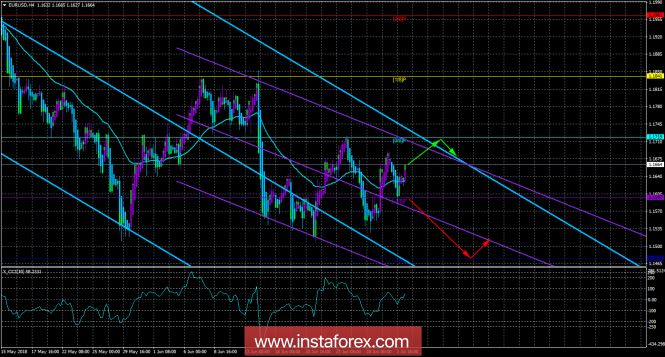
4-hour timeframe

Technical data:
The senior channel of linear regression: direction - down.
The younger channel of linear regression: direction - down.
Moving average (20; flattened) - sideways.
СCI: 58.2331
The currency pair EUR / USD worked on the level of Murray "-1/8" on July 2 and could not gain a foothold below. Bears have recently weakened strength, but bulls lack the desire to form long-term purchases. The market is now uncertain, primarily associated with the actions of Trump, the consequences of which are now very difficult to imagine. Thus, the pair moves every day in different directions without a clear trend. On Tuesday, July 3, the EU will publish a report on retail sales for May and is expected to reduce this figure to 1.4% y / y. Thus, if the forecast comes true, then during the day the bears can again begin to exert pressure on the pair. No more important macroeconomic reports are planned for today, however, as is often the case in recent days, unexpected information may come from the White House. Thus, we continue to monitor all of Trump's performances and his messages on social networks.
Nearest support levels:
S1 - 1.1597
S2 - 1.1475
Nearest resistance levels:
R1 = 1.1719
R2 - 1.1841
R3 = 1.1963
Trading recommendations:
The currency pair EUR / USD was fixed above the removals. Thus, it is recommended to open long positions with the target level of Murray 1.1719. However, the upside potential is now limited, so we open the long lots with small lots.
Short positions will become relevant only below the level of 1.1597, which last time the price could not be overcome. Only, in this case, it will be possible to expect the resumption of the downward trend.
In addition to the technical picture, one should also take into account the fundamental data and the time of their release.
Explanations for illustrations:
The upper channel of linear regression is the blue lines of unidirectional motion.
The lowest linear regression channel is the violet lines of unidirectional motion.
CCI - the blue line in the indicator window.
Moving average (20; smoothed) - the blue line on the price chart.
Levels of Murray - multi-colored horizontal stripes.
Heiken Ashi is an indicator that color bars in blue or purple.
The material has been provided by InstaForex Company - www.instaforex.com