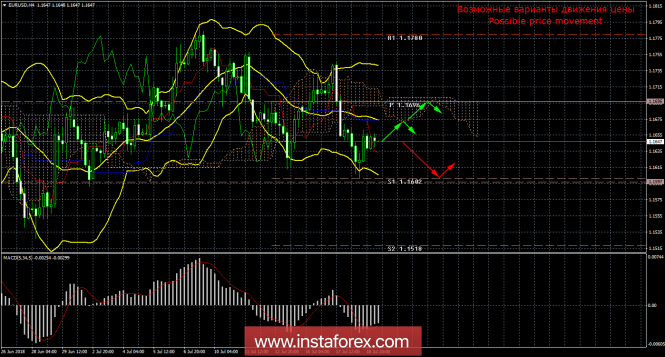
4-hour timeframe

Amplitude of the last 5 days (high-low): 46p - 74p - 49p - 96p - 63p.
The average amplitude for the last 5 days: 66p (71p).
On Wednesday morning of July 18, the EUR/USD currency pair continued to move down, but the second speech by the head of the Fed, Jerome Powell, caused a reduction in "dollar" positions in the afternoon. This time, Powell reported nothing negative. He only noted that the process of normalizing the balance of the Fed can take 3-4 years. Much or little, it's hard to say, given the fact that this balance has been accumulating for 10 years. Powell also said that the number of assets on the balance sheet of the Fed should return to the value "which should be", and expressed the hope that over time, only US Treasuries will remain on the balance sheet.
Also in the morning, the consumer price index was published in the Eurozone. In annual terms, this figure was 2.0%, which fully met the expectations of the market. In monthly terms, inflation slowed to 0.9%. In principle, this report turned out to be neutral and did not cause a stormy reaction of traders. Toward evening, the so-called "Beige Book" was published. Most economic districts noted moderate economic growth and wage growth. However, this information also did not cause a special reaction to the market. The volatility of the instrument declined, but the downward trend persisted. Further perspectives of the US dollar still look much more convincing than Euro-currencies.
However, the issue of the trade war remains on the agenda. This theme has come off the front pages in recent days, but we are only at the very beginning of this epic, which, like Brexit, can last for years and affect the currency and financial markets. Now everyone is wondering what will be the next step of Trump. Will he almost completely import all Chinese imports? As practice shows, Trump's serious steps in the international arena often cause the strengthening of the US dollar.
Trading recommendations:
On the EUR / USD pair, an upward correction began. Actual Buy-positions can be actual small intraday lots with Kijun-Sen line goals and the level of 1.1696 established based on the average volatility of the instrument.
It is recommended to open the sell orders after the correction is completed with the goal of the first level of support at 1.1602. The signal to open shorts can serve as a rebound from the critical line or turn the MACD indicator down.
In addition to the technical picture, one should also take into account the fundamental data and the time of their release.
Explanations to the illustration:
Ichimoku Indicator:
Tenkan-sen is a red line.
Kijun-sen is a blue line.
Senkou Span A is a light brown dotted line.
Senkou Span B - a light purple dotted line.
Chikou Span is a green line.
Bollinger Bands Indicator:
3 yellow lines.
MACD indicator:
Red line and histogram with white bars in the indicator window.The material has been provided by InstaForex Company - www.instaforex.com