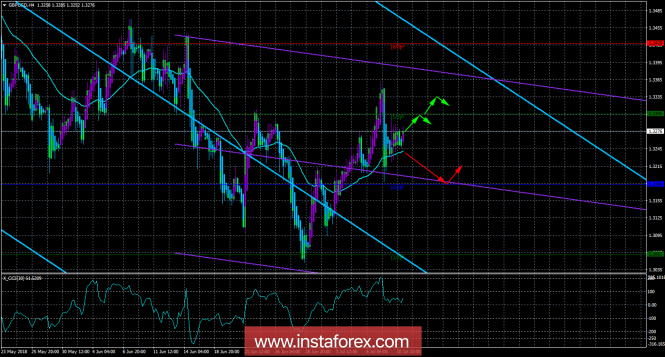
4-hour timeframe

Technical data:
The senior channel of linear regression: direction - down.
The younger channel of linear regression: direction - down.
The moving average (20; flattened) is up.
CCI: 51.5209
On Tuesday, July 10, the currency pair GBP / USD, worked out the movings several times, but could not gain a foothold below it. From a fundamental point of view, it is more preferable to move down, as yesterday the next report failed, this time on industrial production in Great Britain. Keeping in mind the political problems of the United Kingdom, as before, there are no compelling reasons for long-term purchases of the British pound. From a technical point of view, the upward trend in the pair persists, as the price continues to be located above the moving average line. The last bars are painted blue, so there is no signal to open the longs. Today, we should pay attention to the speech of Mark Carney at 15-35 GMT. Given all the events of the past days, the head of the Bank of England can share with the public new and important information on Brexit, permutations in the Parliament of Great Britain.
Nearest support levels:
S1 - 1.3184
S2 - 1.3062
S3 - 1.2939
Nearest resistance levels:
R1 = 1.3306
R2 = 1.3428
R3 = 1.3550
Trading recommendations:
For the pair GBP / USD, the upward trend keeps its prospects. Thus, it is recommended to wait for the signal about the completion of the correction and resume trading on the rise with the targets of 1.3306 and 1.3334.
It is recommended to open sell orders only after traversing the moving average line with a target of 1.3184. In this case, the pair will get a chance to resume the downtrend.
In addition to the technical picture, one should also take into account the fundamental data and the time of their release.
Explanations for illustrations:
The upper channel of linear regression is the blue lines of unidirectional motion.
The junior channel is linear-violet lines of unidirectional motion.
CCI - the blue line in the regression window of the indicator.
Moving average (20; smoothed) - the blue line on the price chart.
Levels of Murray - multi-colored horizontal stripes.
Heikin Ashi is an indicator that color bars in blue or purple.
The material has been provided by InstaForex Company - www.instaforex.com