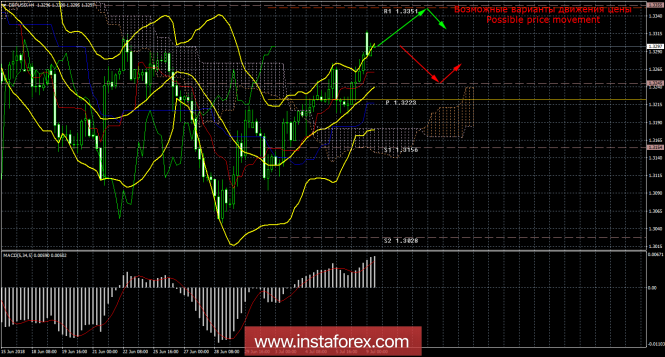
4-hour timeframe

Amplitude of the last 5 days (high-low): 114p - 92p - 79p - 71p - 87p.
The average amplitude for the last 5 days: 89p (100p).
The British pound sterling also reacted well to the not the best macroeconomic statistics from the States. Throughout the trading day, traders bought the pound sterling, and there was a hope for a strong correction against the strengthening of the dollar, which began as early as April 17. At the moment, however, the correction still looks rather weak. Despite local failures of the dollar, this currency remains the most attractive in the foreign exchange market for investment. To spoil its position can only escalate the trade conflict between the States and partners. Traders can still pay attention to the fact that in the trade war, as in any other, there are no winners. Each party will incur certain losses. And now only this factor looks like capable of stopping the long-term "dollar" trend. In other respects, the British pound has practically nothing to oppose to the American currency. The Brexit theme is still not exhausted. Carney fears a "tough" scenario, fears a slowdown in the growth of the world economy due to the trade war and does not know when the Bank of England will begin to tighten monetary policy. Macroeconomic statistics from the UK in the first half of 2018 is mostly disappointing. Thus, at any time the downtrend in the pair may well resume. But this requires some kind of push, an event. On Monday, July 9, the calendar of news from Britain and the US is empty. Thus, today's volatility may drop slightly, and the pair - start to adjust.
Trading recommendations:
On Monday, the GBP / USD keeps the upward movement. Thus, now it is recommended to stay in long positions with a target resistance level of 1.3351. The signal to the closing of the long lines will be the turn of the MACD indicator downwards.
Sell-positions with small lots are recommended to be considered if a signal about the beginning of correction is received. In this case, from the maximum of the day, the pair will be able to decrease by 60-70 points, and in the future to develop the critical Kijun-sen line.
In addition to the technical picture, one should also take into account the fundamental data and the time of their release.
Explanations to the illustration:
Ichimoku Indicator:
Tenkan-sen is a red line.
Kijun-sen is a blue line.
Senkou Span A is a light brown dotted line.
Senkou Span B - a light purple dotted line.
Chinkou Span is a green line.
Bollinger Bands Indicator:
3 yellow lines.
MACD indicator:
Red line and histogram with white bars in the indicator window.
The material has been provided by InstaForex Company - www.instaforex.com