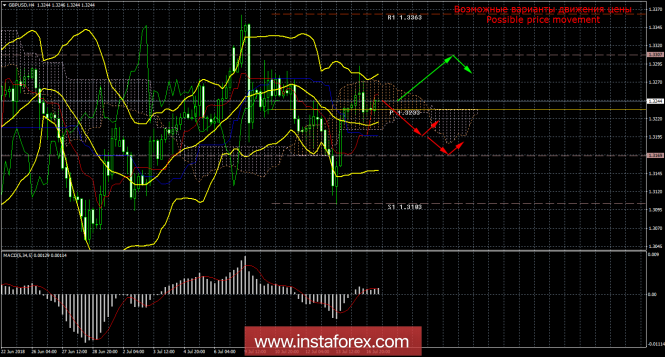
4-hour timeframe

Amplitude of the last 5 days (high-low): 78p - 86p - 64p - 135p - 76p.
The average for the last 5 days is 88p (107p).
The calendar of macroeconomic events of Great Britain yesterday was absolutely empty, however, interesting information came from Prime Minister Theresa May. First, the prime minister was welcomed by the meeting between Trump and Putin and said that at his meeting with the US leader he had agreed on a dialogue with the United States. That is, Britain wants to establish relations with Russia in the long term. This time, Mei was different from her tough stance on Moscow. Secondly, in her Facebook account, May reported that the country was leaving the Customs Union and the EU Single Market in accordance with the Brexit procedure. That is, the Kingdom will conduct its own trade policy and conclude trade agreements with any countries. May also be noted that there will be a new free trade zone between the EU and Britain, and she will not tolerate the establishment of borders between Northern Ireland and Ireland or between Britain and Northern Ireland. After these news, the pound sterling fell in, slightly in value, from the indicator Ichimoku. According to many British politicians, Theresa May is retreating, and her new "soft" version of Brexit no longer matches. Many also wonder if Theresa May be able to keep her post, since after the resignations of Boris Johnson and David Davis, who disagreed with Brexit's plan, the chair under the premiere began to sway more strongly. In general, despite the slight strengthening of the British currency on Friday, July 13, the position of the pound sterling is still very uncertain. Thus, the downward movement can resume at any time.
Trading recommendations:
The GBP / USD currency pair began a downward correction against the new "golden cross". Thus, intraday can be considered soap lots of shorts.
The purchase orders will be available for the MACD indicator turns upwards with the target level of 1.3307, which is calculated based on the average volatility of the instrument. In this case, the bulls will try to form another round of ascending movement.
In addition to the technical picture, one should also take into account the fundamental data and the time of their release.
Explanations to the illustration:
Ichimoku Indicator:
Tenkan-sen is a red line.
Kijun-sen is a blue line.
Senkou Span A is a light brown dotted line.
Senkou Span B - a light purple dotted line.
Chinkou Span is a green line.
Bollinger Bands Indicator:
3 yellow lines.
MACD indicator:
Red line and histogram with white bars in the indicator window.
The material has been provided by InstaForex Company - www.instaforex.com