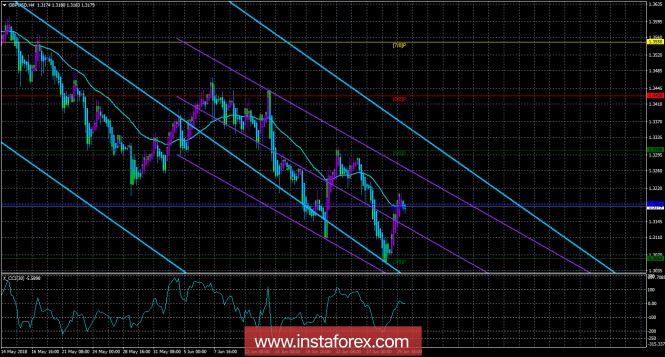
4-hour timeframe

Technical data:
Senior channel of linear regression: direction - down.
Youngest linear regression channel: direction – down.
Moving average (20; flattened) - sideways.
CCI: -5.5896
The GBP/USD currency pair adjusted on Friday to the moving average line, but it did not succeed to secure a foothold above it. UK GDP data did not support the English currency very much, as the report is hardly positive. But the US statistics on income and expenditure was a little disappointing. Nevertheless, despite a relatively strong upward movement in the pair over the last two trading days, the trend for the trading instrument remains downward, as evidenced by the two linear regression channels, still directed downward. Today we should pay attention to the index of business activity in the UK manufacturing sector for June. The British pound often reacts to this report, so it is not recommended to overlook it. The forecasts for the indicator predict a decline, which, in principle, is not surprising on the background of other falling macroeconomic indicators of Great Britain. A weak report can force traders to return to selling the English currency.
Nearest support levels:
S1 = 1.3062
S2 - 1.2939
S3 - 1.2817
Nearest resistance levels:
R1 = 1.3184
R2 = 1.3306
R3 = 1.3428
Trading recommendations:
For the GBP/USD pair, it is now recommended to consider new sell orders with a target of 1.3062. If the Heiken Ashi indicator turns down when the price is below the moving average, this will signal a resumption of the downward movement of the pair.
Longi is recommended to be considered only after confident overcoming by movers of the moving-house. In this case, traders can continue long positions with a target of 1.3306, but for this it would be nice to get a fundamental support.
In addition to the technical picture, one should also take into account the fundamental data and the time of their release.
Explanations for illustrations:
Senior linear regression channel – blue line unidirectional movement.
Low channel of the linear– purple line unidirectional movement.
CCI - the blue line in the regression window of the indicator.
Moving average (20; smoothed) - the blue line on the price chart.
Murray levels - multicolored horizontal stripes.
Heiken Ashi is an indicator that color bars in blue or purple.
The material has been provided by InstaForex Company - www.instaforex.com