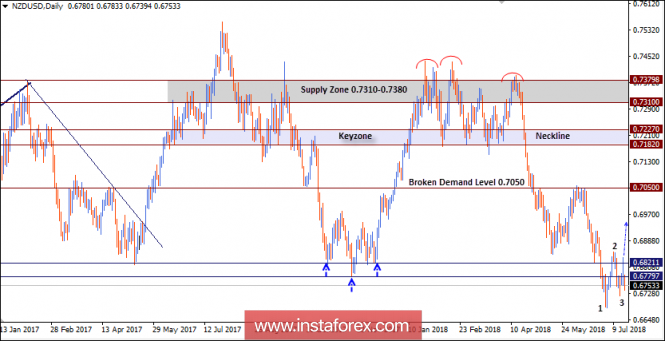
The NZD/USD pair had been trapped between the price levels of 0.7170 and 0.7350 until bearish breakdown of 0.7200 occurred on April 23.
Breakdown of 0.7220-0.7170 (neckline zone) was needed to confirm the depicted reversal pattern. Bearish target levels around 0.7050 and 0.7000 have been achieved already.
The price level of 0.7050 was considered a key-level for the NZD/USD bears That's why, bearish persistence below 0.7050 allowed further bearish decline to occur towards the price levels around 0.6800.
As anticipated, the recent bullish pullback towards the price level of 0.7050 (Broken Demand-Level) offered a good opportunity for a valid SELL entry.
Quick bearish decline took place towards 0.6800 where a false bearish breakdown occurred. This allowed temporary bearish movement to occur towards 0.6680. However, the pair failed to maintain enough bearish momentum.
On July 7, evident bullish rejection pushed the NZD/USD pair above 0.6820 again. This was followed by a recent bullish reversal pattern (123 pattern) which enhances the bullish side of the market.
Recent signs of bullish weakness are being manifested on the chart. The bulls are failing to maintain trading above 0.6820 which endangers the bullish reversal scenario.
Trade Recommendations:
The price zone 0.6750-0.6800 still constitutes a demand zone to be considered for a valid BUY entry.
Bullish fixation above 0.6820 should be maintained to provide enough bullish momentum towards 0.6900-0.6980.
Please be cautious if bearish decline extends below 0.6680 as this invalidates the suggested bullish scenario.
The material has been provided by InstaForex Company - www.instaforex.com