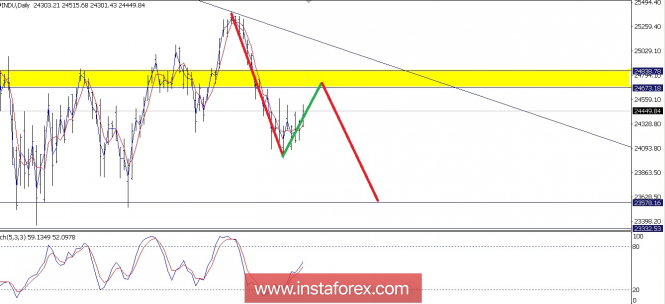
The INDU now looks like loosing its volatility. We can judge this from the overall price making a Descending Triangle on the Daily Chart. This pattern is a trend continuation pattern from the $INDU Bullish bias. However, it seems that a few days later the index will test first the resistance level of 24,673.18 before heading downward to reach the support level of 23,578.16.
(Disclaimer)
The material has been provided by InstaForex Company - www.instaforex.com