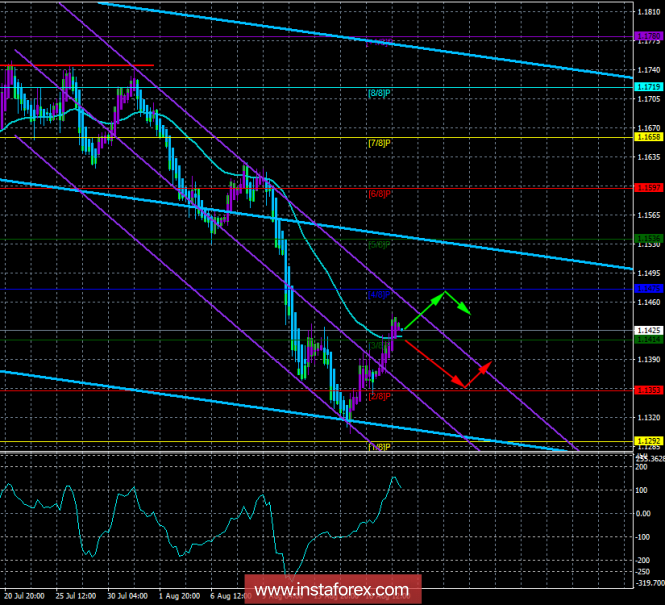
4-hour timeframe

Technical data:
The senior channel of linear regression: direction - down.
The younger channel of linear regression: direction - down.
Moving average (20; flattened) - sideways.
СCI: 105.3381
The currency pair EUR / USD continued to recover on August 17 after heavy losses and even managed to overcome the moving average line. However, the joy of European clubs can not last long. First, in the near future, the States can introduce a new package of trade restrictions against Turkey due to the refusal of the latter to give out to the American side the pastor Andrew Brunson, who was arrested two years ago on suspicion of espionage. Secondly, a very small number of experts believe that the States and China at the forthcoming talks will be able to agree on the de-escalation of the trade conflict. And these two factors can cause a new strong demand for the US currency. In the issue with Turkey, America also indirectly exerts pressure on the European Union, since more loans to this country were issued by European banks. Thus, in the event of problems with servicing or repayment of the debt, liquidity problems will arise in EU banks. It should also be noted that Turkey follows in the footsteps of China and does not want to make concessions to America. Erdogan has already urged the Turkish people to get rid of the dollar and the euro, from buying American technology, hinting, first of all, on Apple products. However, it seems that this is only the very beginning of the trade war the US has unleashed and which has already seriously affected the PRC and Turkey.
Nearest support levels:
S1 - 1.1414
S2 - 1.153
S3 - 1,1292
Nearest resistance levels:
R1 = 1.1475
R2 = 1.1536
R3 = 1.1597
Trading recommendations:
The currency pair EUR / USD was fixed above the removals. Thus, on August 20, long positions with the target of 1.1475 are relevant, but with small lots, since both channels of linear regression are still directed downwards, I signal a downward trend.
It is recommended to open sell orders after traversing the moving average line with a target of 1,1353. In this case, the initiative on the instrument will return to the hands of the bears, and the downward trend will resume.
In addition to the technical picture, one should also take into account the fundamental data and the time of their release.
Explanations for illustrations:
The upper channel of linear regression is the blue lines of unidirectional motion.
The lowest linear regression channel is the violet lines of unidirectional motion.
CCI - the blue line in the indicator window.
Moving average (20; smoothed) - the blue line on the price chart.
Levels of Murray - multi-colored horizontal stripes.
Heikin Ashi is an indicator that color bars in blue or purple.
The material has been provided by InstaForex Company - www.instaforex.com