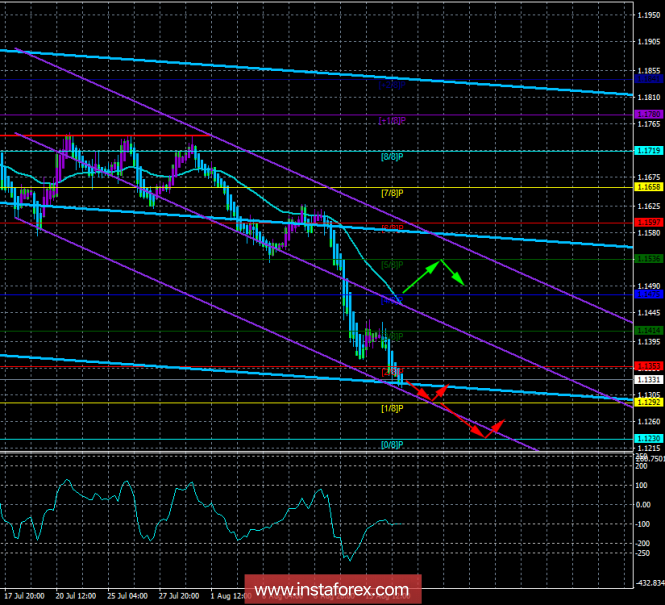
4-hour timeframe

Technical data:
The senior channel of linear regression: direction - down.
The younger channel of linear regression: direction - down.
Moving average (20, smoothed) - down.
СCI: -100.4550
The currency pair EUR / USD resumed the downward movement on August 14 after a minimal upward correction. Thus, the European currency is still in a downward trend. In the meantime, Turkish President Erdogan called on the population to boycott the purchase of American-made goods and move to settlements in lira, instead of the dollar. Honestly, the response of the leader of Turkey to Trump duties is still very weak. It should be understood that the call for a boycott is not specific sanctions or bans that can give concrete results. Given the popularity of Apple's technology, a very small number of Turkish citizens will really refuse to buy the goods of this brand. Thus, we state the fact: so far there has been no response to the US sanctions from Erdogan. This means that the Turkish lira can continue its decline against the US dollar, and together with the lira and the euro. Today in the US will be published reports on changes in the volume of industrial production and retail sales. However, as we have already said, traders now pay a very indirect attention to any macroeconomic reports. Thus, both US reports should fail today, so that traders would at least fix profit on dollar positions. Otherwise, the downward movement is likely to continue.
Nearest support levels:
S1 - 1.1292
S2 - 1.1230
S3 - 1.1169
Nearest resistance levels:
R1 = 1.153
R2 = 1.1414
R3 = 1.1475
Trading recommendations:
The currency pair EUR / USD resumed its downward movement. Thus, today it is recommended to stay in shorts or open new ones with the targets of 1.1292 and 1.1230. Turning indicator Heikin Ashi up, signal to manually close orders for sale.
Long positions are recommended to be considered only after fixing the price above the moving average line with the target of 1.1536. In this case, the initiative on the instrument, at least for a while, will pass into the hands of bulls.
In addition to the technical picture, one should also take into account the fundamental data and the time of their release.
Explanations for illustrations:
The upper channel of linear regression is the blue lines of unidirectional motion.
The lowest linear regression channel is the violet lines of unidirectional motion.
CCI - the blue line in the indicator window.
Moving average (20; smoothed) - the blue line on the price chart.
Levels of Murray - multi-colored horizontal stripes.
Heikin Ashi is an indicator that color bars in blue or purple.
The material has been provided by InstaForex Company - www.instaforex.com