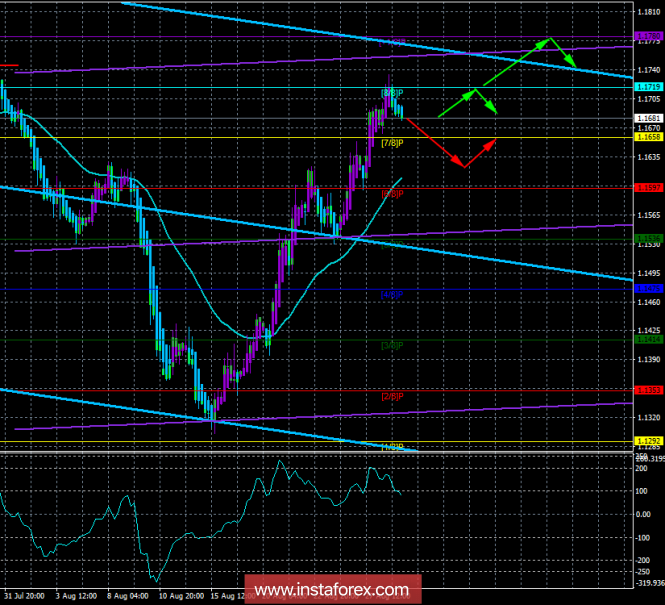
4-hour timeframe

Technical data:
Senior channel of linear regression: direction - down.
The younger channel of linear regression: direction - down.
The moving average (20; flattened) is up.
СCI: 79.2546
On August 28, the EUR/USD currency pair perfectly worked Murray's level of "8/8" at 1.1719 and could not overcome in the first attempt. The trade dispute provoked by Trump in recent weeks has come down from the front pages. Against this background, the US dollar continues to depreciate against many currencies, which undoubtedly pleases the US leader. However, it is too early to talk about the end of the trade conflict or at least its weakening. It is still unclear what trade duties will ultimately affect China. Thus, we can count on new information at any time from Washington, which again will force traders to actively buy up the American currency. Trump can again prevent this at least try to stop it. But whether it will be possible to do this from the leader of the States, given the general predisposition of the markets to buy the dollar, it is still difficult to say. In the first place, Trump now has the task of negotiating the best terms with his main trading partners. Thus, we continue to believe that the probability of resuming the growth of the dollar is very high. Determining the moment when the markets will start buying dollars again, it will be quite simple by technical indicators.
Nearest support levels:
S1 = 1.1658
S2 - 1.1597
S3 - 1.1536
Nearest resistance levels:
R1 = 1.1719
R2 = 1.1780
R3 = 1.1841
Trading recommendations:
The EUR/USD currency pair has started a new round of correction. Thus, today the pair can descend to the moving-average. It is still recommended to consider shorts only below the moving average line, which will be a signal to the transition of the instrument to a new downtrend.
New longs are recommended to open in the event of a turn of the Heiken-Ashi indicator to move upward with the targets of 1,1719 and 1,1780. Above the moving average, the prospects for the uptrend persist despite the purely technical grounds for such growth.
In addition to the technical picture, one should also take into account the fundamental data and the time of their release.
Explanations for illustrations:
The upper channel of linear regression is the blue lines of unidirectional motion.
The lowest linear regression channel is the violet lines of unidirectional motion.
CCI - the blue line in the indicator window.
Moving average (20; smoothed) - the blue line on the price chart.
Levels of Murray - multi-colored horizontal stripes.
Heiken Ashi is an indicator that color bars in blue or purple.The material has been provided by InstaForex Company - www.instaforex.com