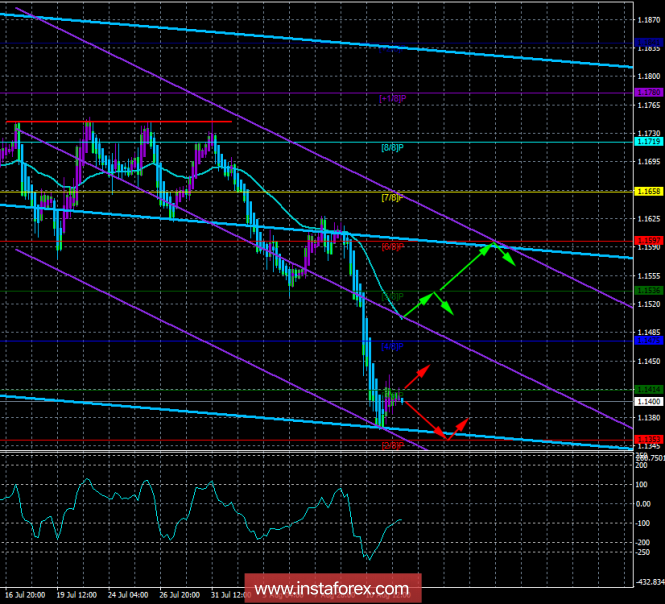
4-hour timeframe

Technical data:
Higher channel of linear regression: direction - down.
The lower channel of linear regression: direction - down.
Moving average (20, smoothed) - down.
СCI: -83.6888
On August 13, The EUR/USD currency pair finally started an upward correction. In fact, it was impossible to overcome the Murray level "3/8" - 1.1414, hence, there is a high probability of resuming the downward movement of the instrument at this moment. Today, the preliminary value of Eurozone's GDP for the second quarter will be published, as well as changes in industrial output for June. However, traders now pay very little attention to any macroeconomic reports as mentioned yesterday. Thus, the presence or absence of new performances by Donald Trump will be much more important. If there are no new messages from the US leader today, the European currency may recover slightly, although it's obvious that traders have little desire to decrease short positions or open long ones. Thus, the euro continues to become cheaper generally due to global fundamental reasons, such as fears for the European Union which can drag Turkey down against Trump, who recently introduced tangible trade sanctions. Any escalation of the trade conflict with Turkey or China may provoke an even weaker European currency.
Nearest support levels:
S1 - 1.153
S2 - 1.1292
S3 - 1.1230
Nearest resistance levels:
R1 = 1.1414
R2 = 1.1475
R3 = 1.1536
Trading recommendations:
The EUR/USD currency pair began correction. Thus, opening new short position with the target at 1.1333, it is recommended to wait for the reversal of the Heiken Ashi indicator. Otherwise, the corrective movement may continue.
It is suggested to consider purchase orders before fixing the price above the removals. Rejecting a correction is not recommended, as it is very weak and can be completed at any time.
In addition to the technical picture, one should also take into account the fundamental data and the time of their release.
Explanations for illustrations:
The upper channel of linear regression is the blue lines of unidirectional motion.
The lowest linear regression channel is the violet lines of unidirectional motion.
CCI - the blue line in the indicator window.
Moving average (20; smoothed) - the blue line on the price chart.
Murray Levels - multi-colored horizontal stripes.
Heiken Ashi is an indicator that color bars in blue or purple.* The presented market analysis is informative and does not constitute a guide to the transaction.
The material has been provided by InstaForex Company - www.instaforex.com