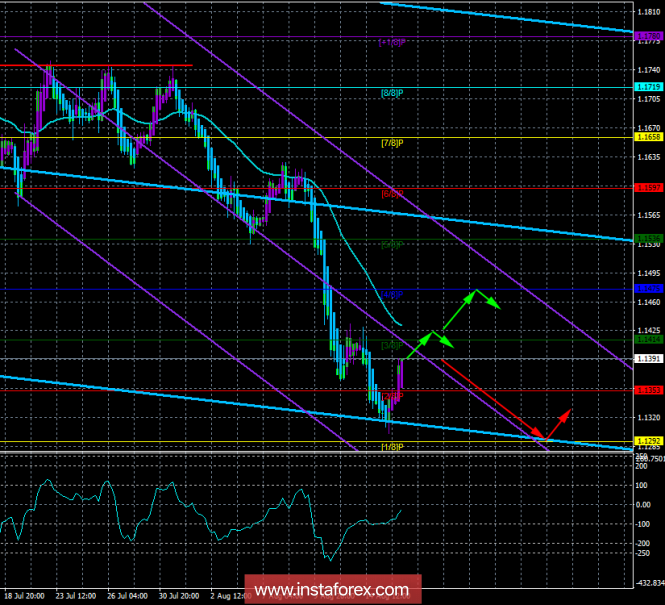
4-hour timeframe

Technical data:
Higher channel of linear regression: direction - down.
The lower channel of linear regression: direction - down.
Moving average (20, smoothed) - down.
СCI: -24.2884
On August 15, the EUR/USD currency pair after long sorrow started an upward correction with the first target - moving. The reasons for the correction are purely technical, since no significant information was available to traders yesterday. Thus, traders would likely began to fix the profit on dollar positions. Now, the key moment for the pair will be working out the moving middle line. If market participants failed to overcome the trend, then the downtrend will resume and the pair will be able to renew its lows again. If the removals will be beaten, then the bulls will finally get a chance to form an uptrend, but this may require fundamental support and the latest macroeconomic reports from the Eurozone and the US shows a little hope of tangible support. Today, the trade balance for June will be published in Europe and the number of applications for unemployment benefits in the United States. Both reports have a weak degree of significance and are unlikely to have a strong impact on the trading course. Thus, there are technical factors initially, as well as possible new statements or actions of the US leader Donald Trump as the market reacts very violently.
Nearest support levels:
S1 - 1.153
S2 - 1.1292
S3 - 1.1230
Nearest resistance levels:
R1 = 1.1414
R2 = 1.1475
R3 = 1.1536
Trading recommendations:
The EUR/USD currency pair began to be corrected. Correction can be completed near the trend, therefore, the rebound from this line (with the Heiken Ashi reversal down) can be regarded as a signal for opening of new short positions with a target at 1.1292.
Long positions are recommended to be considered only after fixing the price above the trend with the target of 1.1475. In this case, the initiative on the instrument will for some time pass into the hands of bulls, which will try to form at least a short-term uptrend.
In addition to the technical picture, traders should also consider the fundamental data and the time of their release.
Explanations for illustrations:
The upper channel of linear regression is the blue lines of unidirectional motion.
The lowest linear regression channel is the violet lines of unidirectional motion.
CCI - the blue line in the indicator window.
Moving average (20; smoothed) - the blue line on the price chart.
Murray Levels - multi-colored horizontal stripes.
Heiken Ashi is an indicator that color bars in blue or purple.* The presented market analysis is informative and does not constitute a guide to the transaction.
The material has been provided by InstaForex Company - www.instaforex.com