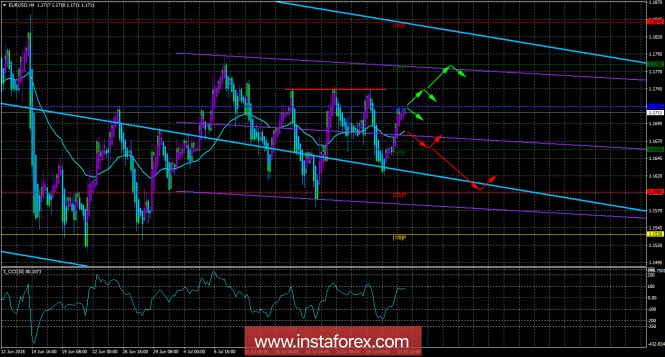
4-hour timeframe

Technical data:
Higher channel of linear regression: direction - down.
The lower channel of linear regression: direction - down.
The moving average (20; flattened) is up.
СCI: 80.1073
The EUR/USD currency pair on July 30, showed impressive volatility despite the lack of important macroeconomic information, and was fixed above the removals after reaching the Murray level of "4/8". The "Swing" on the instrument continues and we can see a quite downward movement today with price fixing below the moving average line. The first of the two target levels has been worked out. Bulls can also try to work out the level of 1.1745, which had already been reached three times before. Today, the preliminary values of the consumer price index for July and GDP for the second quarter will be published in Europe. It is expected that the inflation rate will not change and will amount to 2%, while the GDP growth rate may slow down to 2.2%. In general, any negative information can send the euro back down again. Especially, the current price values has high probability of a reversal. At the same time, it should be noted that the reports published today are only preliminary values, not final ones. Reactions to them in general may not follow any.
Nearest support levels:
S1 = 1.1658
S2 - 1,1597
S3 - 1.1536
Nearest resistance levels:
R1 = 1.1719
R2 = 1,1780
R3 = 1.1841
Trading recommendations:
The EUR/USD currency pair was fixed above the removals. Thus, it is recommended to maintain long positions now with the targets of 1.1719 and 1.1745, where the upward movement may stop. Therefore, it is possible to fix profits within these levels or expect a downward turn of the Heiken Ashi indicator and close deals on this signal.
Selling orders can be opened after fixing the price below the moving with targets 1.1658 and 1.1597. In this case, the initiative on the instrument can go into the hands of bears for several days.
In addition to the technical picture, one should also take into account the fundamental data and the time of their release.
Explanations for illustrations:
The upper channel of linear regression is the blue lines of unidirectional motion.
The lowest linear regression channel is the violet lines of unidirectional motion.
CCI - the blue line in the indicator window.
Moving average (20; smoothed) - the blue line on the price chart.
Levels of Murray - multi-colored horizontal stripes.
Heiken Ashi is an indicator that color bars in blue or purple.* The presented market analysis is informative and does not constitute a guide to the transaction.
The material has been provided by InstaForex Company - www.instaforex.com