
4-hour timeframe
Technical data:
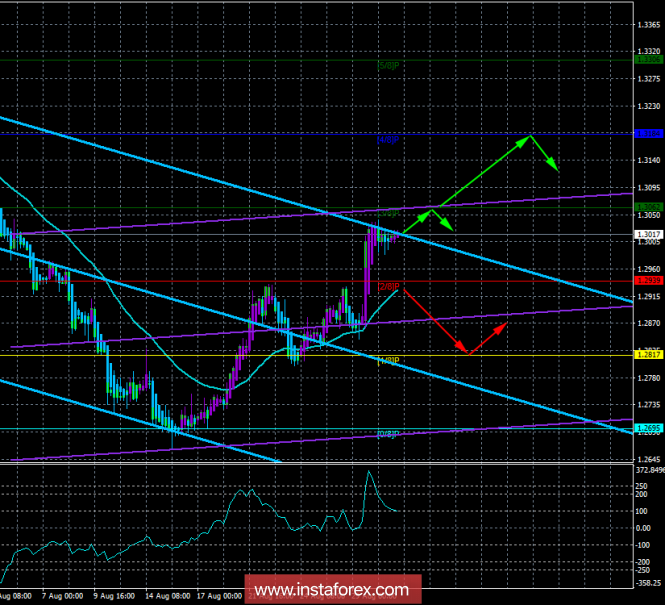
The senior channel of linear regression: direction - down.
The younger channel of linear regression: the direction is up.
The moving average (20; flattened) is up.
CCI: 98.3854
The GBP / USD currency pair spent the last day in a very narrow price range and could not continue the upward movement that had begun the day before. Strong overbought indicator CCI warns and possible correction, but for yesterday and it did not start. Traders are hiding and waiting for new reasons for opening those or other positions. Unfortunately, there are no important macroeconomic publications on the last trading day of the week either in the UK or in the States. Thus, today volatility can remain at a rather low level, and traders, without having new interesting information, may not risk in vain on the eve of the weekend. Proceeding from this, the hope today is only for unplanned and unexpected speeches of the main persons of Britain and the USA. Only, in this case, it will be possible to count on the growth or fall of the pair, otherwise, the lateral correction may continue. From the technical point of view, the last bars of Heikin Ashi have turned purple, so there is a formal signal for purchases. However, all three of the last purple bars are extremely small, and therefore the signal is very weak. At the beginning of the European trading session, it is recommended to observe the pair for the possible strengthening of the movement and, accordingly, to strengthen the signal for purchase.
Nearest support levels:
S1 = 1.2939
S2 = 1.2817
S3 - 1.2695
Nearest resistance levels:
R1 = 1.3062
R2 = 1.3184
R3 = 1.3306
Trading recommendations:
The GBP / USD pair began a lateral correction. Updating the high of the previous day can be regarded as a signal to new purchases with a target of 1.3062. Overcoming this level will make the current goal for Long 1.3184.
It is recommended to open a sell order not earlier than fixing the price below the moving average line with the target of 1.2817. However, at the moment the price is far enough from the Moving, so today this condition is unlikely to be met.
In addition to the technical picture, one should also take into account the fundamental data and the time of their release.
Explanations for illustrations:
The upper channel of linear regression is the blue lines of unidirectional motion.
The junior channel is linear-violet lines of unidirectional motion.
CCI - the blue line in the regression window of the indicator.
Moving average (20; smoothed) - the blue line on the price chart.
Levels of Murray - multi-colored horizontal stripes.
Heikin Ashi is an indicator that color bars in blue or purple.
The material has been provided by InstaForex Company - www.instaforex.com