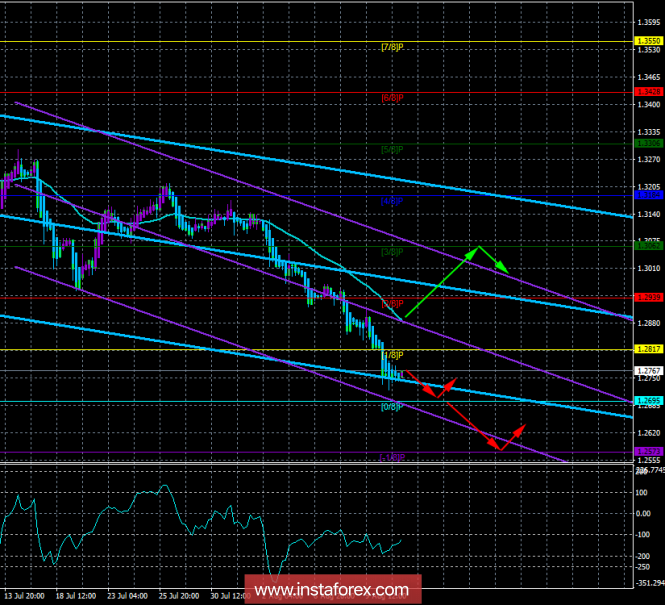
4-hour timeframe

Technical data:
Senior channel of linear regression: direction - down.
The younger channel of linear regression: direction - down.
Moving average (20, smoothed) - down.
CCI: -123.8624
The GBP / USD currency pair also continued to confidently move downwards without a single sign of correction on August 10. The preliminary value of UK GDP data for the second quarter published on Friday did not surprise traders, as it corresponded to the forecast of 1.3%. They are slightly pleased with industrial production, showing an increase in June of 1.1% y/y. However, this one report clearly could not save the pound sterling from new sales. Traders still do not receive any positive signals from the United Kingdom, so there is no reason to buy English currency. Inflation in the United States did not meet the forecasts of 2.9% y/y against the forecast of 3.0%. However, this report had no impact on the US currency. Thus, we can state the fact that macroeconomic reports now have almost no effect on the movement of the pair and market participants need to fully focus once again on the foreign policy of Donald Trump. It is this theme that worries the most the markets and the public. In the meantime, the dollar continues to grow on favorable expectations of traders about the future state of the economy and the US trade balance.
Nearest support levels:
S1 - 1.2695
S2 - 1,2573
S3 - 1.2451
Nearest resistance levels:
R1 = 1.2817
R2 = 1.2939
R3 = 1.3062
Trading recommendations:
The GBP / USD pair continues its downward movement, as evidenced by the blue bars. Thus, on August 13, it is recommended to trade on a decline with the first target at 1.2695, and in case of a breakout on the target of 1.2573 before the indicator turn of Heiken Ashi to the top.
Purchase orders will become relevant only after the traders have overcome the moving average line with a target of 1.3062. In this case, the pair can start a short-term uptrend, but there are no fundamental reasons for this now.
In addition to the technical picture, one should also take into account the fundamental data and the time of their release.
Explanations for illustrations:
The upper channel of linear regression is the blue lines of unidirectional motion.
The junior channel is linear-violet lines of unidirectional motion.
CCI - the blue line in the regression window of the indicator.
Moving average (20; smoothed) - the blue line on the price chart.
Levels of Murray - multi-colored horizontal stripes.
Heiken Ashi is an indicator that color bars in blue or purple.The material has been provided by InstaForex Company - www.instaforex.com