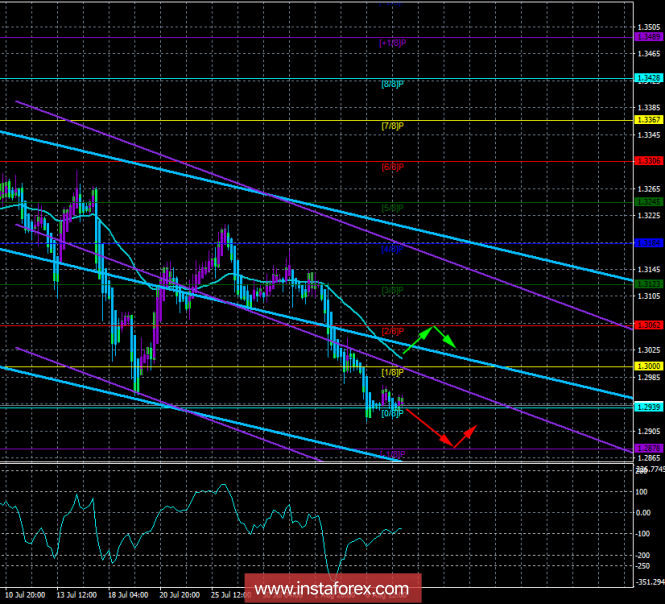
4-hour timeframe

Technical data:
Upper linear regression channel direction - down.
The lower channel of linear regression: direction - down.
Moving average (20, smoothed) - down.
CCI: -86.4419
On August 7, the GBP/USD currency pair was trading near the Murray level "0/8" with a minimum range of movements against the background of the complete absence of any macroeconomic information. If the EUR/USD currency pair has started a significant correction, the positions of the pound sterling remain extremely weak – traders do not even take profit on sell orders. Thus, all short positions remain open, and at any moment bears can start to increase them if they do not receive any information that will force them to close their shorts. By the way, such information is not expected at least for Wednesday. Of course, there may be some unplanned speech by Theresa May or any of the British Parliament or Donald Trump. Potentially, these statements can have an impact on the course of trading. But as long as they are not there, the pair's chances for a downward movement and consolidation below Murray's level "0/8" are much greater than at least correction. The most interesting thing is that no important macroeconomic statistics are expected either from the UK or the US on Thursday. This means that the volatility of the instrument may remain extremely low for the rest of the current trading week.
Nearest support levels:
S1 – 1,2939
S2 – 1,2878
S3 – 1,2817
Nearest resistance levels:
R1 – 1,3000
R2 – 1,3062
R3 – 1,3123
Trading recommendations:
The GBP/USD pair tested the level of 1,2939 and began a side correction. Thus, it is currently recommended to wait for the resumption of the downward movement and on the signal to overcome the level of 1.2939 to open new short positions with the goal of 1.2878.
It is recommended to consider purchase orders not earlier than consolidating bulls above the moving average line than is not expected in the near future. However, if this happens, the pair will get another small chance to strengthen at 1.3062.
In addition to the technical picture, fundamental data and the time of their release should also be taken into account.
Explanation of illustrations:
Upper linear regression channel – blue line unidirectional movement.
Low channel of the linear– purple line unidirectional movement.
More: CCI - the blue line in the regression window of the indicator.
Moving average (20;smoothed) - the blue line on the price chart.
Murray's levels are multi-colored horizontal stripes.
Heiken Ashi is an indicator that color bars in blue or purple.The material has been provided by InstaForex Company - www.instaforex.com