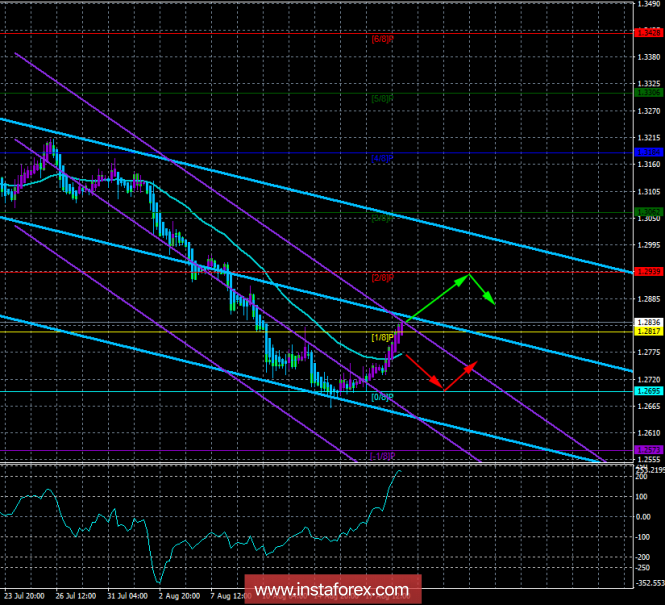
4-hour timeframe

Technical data:
Higher channel of linear regression: direction - down.
The lower channel of linear regression: direction - down.
Moving average (20; flattened) - sideways.
CCI: 229.9207
On August 20, the GBP/USD currency pair finally worked and overcame the moving middle line. But the main thing is that the bulls on the instrument finally activated and began to buy the British pound. It is difficult to say how long the growth of the British currency will continue, but the consolidation above the removals will indicate support for the bulls by technical factors. There is nothing special to note on the macroeconomic events neither on the first trading day of the week nor in the second. But in this situation, it can even be in the hands of the British pound, given the fact that we have not received any optimistic reports and after a long time, the only report from the UK is about the willingness of the Bank of England to further tighten monetary policy regardless. The US data were continually ignored by traders and attention is drawn only to the speeches of Donald Trump, which will soon be predicted easily: the introduction of new trade restrictions against another country. In most cases, reports about the trade war escalation between the States and partners led to an increase in the US currency. However, sooner or later such an effect should be completed, as market participants failed to understand that the trade war will negatively affect the US economy, at least in the medium term.
Nearest support levels:
S1 = 1.2817
S2 - 1.2695
S3 - 1.2573
Nearest resistance levels:
R1 = 1.2939
R2 = 1.3062
R3 = 1.3184
Trading recommendations:
The GBP/USD pair overcame the removals. Thus, it is recommended to open long positions with the target at 1.2939. It is also recommended not to open long in large lots, since both linear regression channels are directed downward, and the CCI indicator is heavily overbought.
Sell-positions are recommended to be opened only after the reverse fixing of the price below the moving average line. In this case, the downward trend on the instrument will resume, and the shorts will become relevant with the target at 1.2695.
In addition to the technical picture, traders should consider the fundamental data and the time of their release.
Explanations for illustrations:
The upper channel of linear regression is the blue lines of unidirectional motion.
The lower channel is linear-violet lines of unidirectional motion.
CCI - the blue line in the regression window of the indicator.
Moving average (20; smoothed) - the blue line on the price chart.
Murray Levels - multi-colored horizontal stripes.
Heiken Ashi is an indicator that color bars in blue or purple.* The presented market analysis is informative and does not constitute a guide to the transaction.
The material has been provided by InstaForex Company - www.instaforex.com