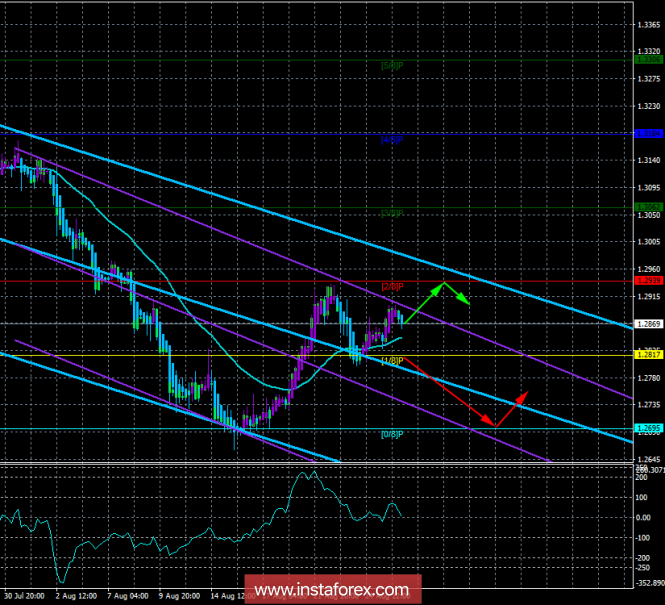
4-hour timeframe

Technical data:
Higher channel of linear regression: direction - down.
The lower channel of linear regression: direction - down.
Moving average (20; flattened) - sideways.
CCI: -18.5388
On August 27, the GBP/USD currency pair failed to overcome the moving average line. However, the traders could not resume the short-term ascending trend either. Price departed from the moving, but not far. Thus, bears can make a new attempt at any time to overcome the moving middle line. From the fundamental point of view, there is nothing to be noted for now. The only more or less significant event was the speech of French President Emmanuel Macron, who expressed the hope that an agreement between the EU and Great Britain will be signed before the end of the year. Also, Macron noted that the UK's exit from the EU is its decision, which should be respected. However, the Brexit procedure should in no case harm the European Union. As you can see, nothing super important was sounded, as the emphasis was once again laid on the fact that all negotiations on Brexit should be completed before the end of the year. Previously, it was reported that the British Prime Minister Theresa May could deliberately delay the negotiations in the hope of supporting Donald Trump, who had previously suggested that Britain to sue the EU. However, it seems that the European Union does not intend to make any concessions in the negotiations and wishes to complete them by the end of the year.
Nearest support levels:
S1 = 1.2817
S2 - 1.2695
S3 - 1.2573
Nearest resistance levels:
R1 = 1.2939
R2 = 1.3062
R3 = 1.3184
Trading recommendations:
The GBP/USD remains above the moving average line. However, the last closed bar is painted in blue, so a correction may now begin which is not recommended to execute. If the next bar turns purple, you can open new lines with the target of 1.2939.
Selling orders will become relevant with the target of 1.2695 if traders manage to overcome the moving and Murray level "1/8". In this case, the downtrend may resume and the initiative for the instrument will pass into the hands of the bears.
In addition to the technical picture, one should also take into account the fundamental data and the time of their release.
Explanations for illustrations:
The upper channel of linear regression is the blue lines of unidirectional motion.
Lower channel linear - purple lines of unidirectional movement.
CCI - the blue line in the regression window of the indicator.
Moving average (20; smoothed) - the blue line on the price chart.
Murray Levels - multi-colored horizontal stripes.
Heiken Ashi is an indicator that color bars in blue or purple.
* The presented market analysis is informative and does not constitute a guide to the transaction.
The material has been provided by InstaForex Company - www.instaforex.com