The leader of the precious metals sector, who marked its worst start in the last decade, managed to take a breather due to the strengthening of the Chinese yuan and the Japanese yen against the US dollar. The strong US currency has become the main culprit of the XAU/USD pair slumping by 7% since the beginning of the year. According to the World Gold Council report, global demand fell to 1959 tons in January-June, which is the lowest value since 2009. During the same period in 2017 it was about 2086 tons. And while interest in jewelry and the use of metal in the industry has been stable, the outflow of capital from the ETF became the main driver of falling prices.
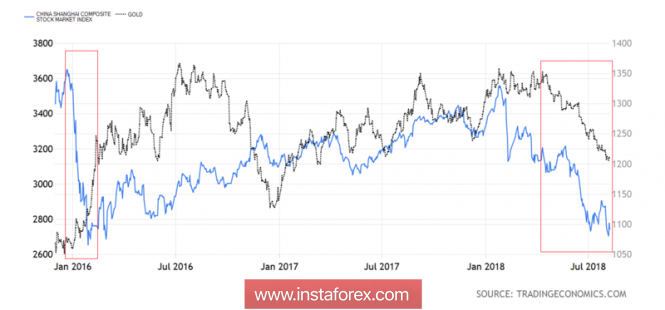
According to WGC research, the reserves of specialized exchange-traded funds increased by a modest 60.9 tons in the first half of 2018. In January-June 2017, the process was significantly faster (+160.9 tons). The dog is buried in the flight of American investors from the market. Against the background of the dispersal of US GDP to 4.1% q/q, they preferred to buy securities rather than revenue-generating precious metals. The story of the collapse of Chinese stock indices under the influence of the slowdown of the Chinese economy and trade wars did not help either. If at the beginning of 2016 gold grew in response to the fall of Shanghai Composite, then this year assets prefer to go one way.
Dynamics of gold and the Shanghai Composite

If we focus on the dynamics of capital outflow from the ETF, we can assume that the XAU/USD will continue the downward campaign. Thus, according to Commerzbank's estimates, after the loss of stock of specialized exchange-traded funds of 29 tons in July, from the beginning of August they sank by another 16 tons. The bank expects that in the near future, under the influence of aggressive monetary tightening of the Fed, gold will test the psychologically important mark of $1200 per ounce. Supporters and speculators, who as of July 31 accumulated a record from 2006 net position on the analyzed asset in the futures market 27 156 contracts, equivalent to 2.7 million ounces.
Standard Bank, on the contrary, believes that the black band for the precious metal has remained in the past. The factor of four increases in the federal funds rate in 2018 is practically taken into account in the quotes of the USD index (the futures market gives about 70% of the probability of such an outcome), investors are unlikely to be surprised by this. But the slower normalization of monetary policy of the Fed or the loss of US GDP by the pair can lead to an increase in XAU/USD quotes to $1,260 per ounce in the third quarter. Before the end of the year, gold can test the level of $1300.
The pluralism of opinions allows the "bulls" of the precious metal to take a breath and contributes to its consolidation in the range of $1205-1235 per ounce. Investors will closely monitor the release of data on US inflation for July. Overclocking the CPU to 3% and above will increase the chances of four Fed rate increases and will contribute to the strengthening of the dollar.
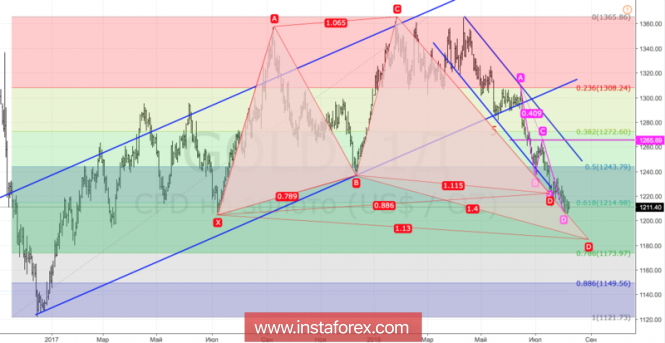
Technically, gold reaching the convergence zone of $1185-1220 per ounce (targets for 88.6% and 113% on the "Double top" pattern) increases the risks of a rollback to the current short-term downward trend.
Gold, daily chart

