EUR / USD
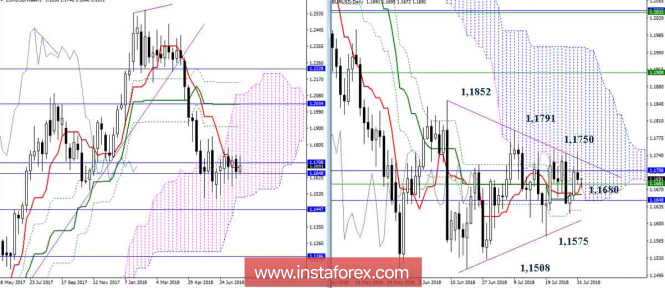
The next testing of the upper trend and the nearest maximum extremum (1.1750) in the day format failed, the pair returned to the center of the uncertainty zone (1.1680). As a result, all the conclusions and expectations voiced earlier remain. The tasks of rivals have not changed. For players on the rise are important 1.1750 - 1.1791 - 1.1852, for players to go down the path lies through 1.1575 - 1.1508.

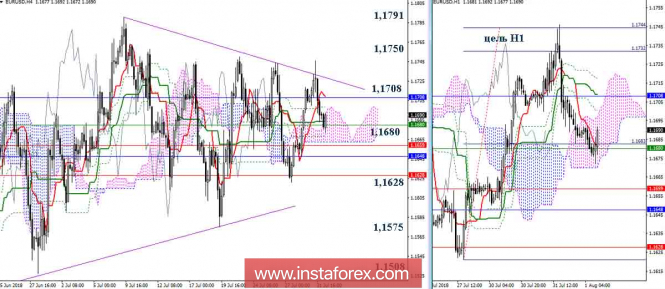
At the ascent, the target for the breakdown of the H1 cloud (1.1744) was tested and a maximum (1.1750) was tested. These resistances could limit the ascent, the pair returned to the zone of uncertainty and attraction. The center of the zone still forms clouds of lower dimes and short-term trends of the day (1.1685) and weekly (1.1680) times. If one of the players now again makes an attempt to leave the zone of attraction (1.1708 - 1.1628), the main task, as before, will be to update the extremes, with subsequent reliable securing beyond their limits.
Indicator parameters:
All time intervals 9 - 26 - 52
The color of indicator lines:
Tenkan (short-term trend) - red,
Kijun (medium-term trend) - green,
Fibo Kijun is a green dotted line,
Chinkou is gray,
Clouds: Senkou Span B (SSB, long-term trend) - blue,
Senkou Span A (SSA) - pink.
The color of additional lines:
Support and resistance MN - blue, W1 - green, D1 - red, H4 - pink, H1 - gray,
Horizontal levels (not Ichimoku) - brown,
Trend lines - purple.
The material has been provided by InstaForex Company - www.instaforex.com