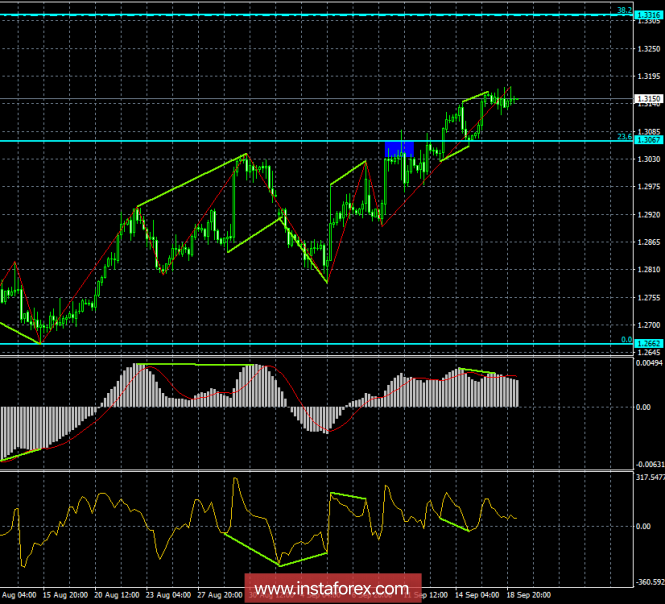
4h

The new bearish divergence, formed by the MACD indicator on the 4-hour chart, allowed the GBP / USD pair to stop the growth process, but not to start the fall. The pair is still able to turn in favor of the US currency and begin a decline in the direction of the correction level of 23.6% to 1.3067, but the passage of the last peak of the divergence will work in favor of continuing growth towards the corrective level of 38.2% at 1.3316. On September 19, there are no new brewing divergence for any indicator.
The Fibo grid was established on the boundaries of April 17, 2018 and August 15, 2018.
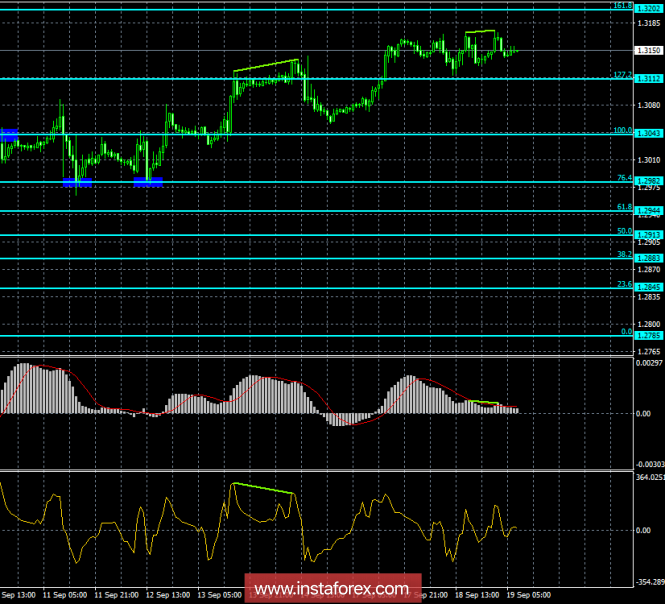
1h

On the hourly chart, the pair also suspended the growth process due to the bearish divergence of the MACD indicator. As a result, today the pair can perform a return to the Fibo level of 127.2% at 1.3112. Passing the last peak of the divergence will allow traders to count on the resumption of growth in the direction of the correction level of 161.8% at 1.3202. The consolidation of the pair above the Fibo level of 161.8% will increase the chances of the growth to continuing growth towards the next correction level of 200.0%.
The Fibo grid was established on the boundaries of August 30, 2018 and September 5, 2018.
Recommendations for traders:
Purchases of the GBP / USD pair can be carried out with the target of 1.3202 and a stop loss order under the correction level of 127.2% if there is a retreat from the Fibo level of 1.3112 (hourly chart).
Sales of the GBP / USD pair can now be carried out with a target of 1.3112 and a Stop Loss order over the last peak of the divergence.
The material has been provided by InstaForex Company - www.instaforex.com