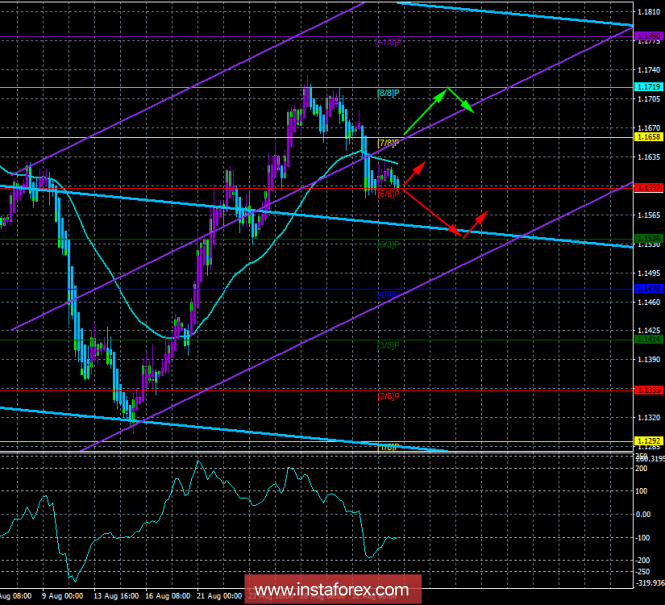
Technical data:
The senior channel of linear regression: direction - down.
The younger channel of linear regression: the direction is up.
Moving average (20, smoothed) - down.
СCI: -118.6357
The currency pair EUR / USD on September 3 continued to be below the moving average line, but it was not possible to overcome the level of Murray "6/8". Nevertheless, the prospects for a further decline in the euro are quite good, and the last two blue bars indicate that the decline may continue at today's European trading session. From the euro area, no important and interesting macroeconomic reports were received on the first trading day of the week. Tuesday, September 4, is also empty in terms of news. Mario Draghi has not spoken for a long time, and all the attention of the market is still focused on the States and Donald Trump. Thus, it all comes down to what nextstep Trump will take in trade wars and in relation to whom. However, the US dollar, even without new information from the US leader, can continue to strengthen. Most of the fundamental factors remain on the side of the dollar. Thus, the technical component now also supports the American currency. In the States today will be the index of business activity in the ISM production sector, but it is of little significance.
Nearest support levels:
S1 - 1.1597
S2 - 1.1536
S3 - 1.1475
Nearest resistance levels:
R1 = 1.1658
R2 = 1.1719
R3 = 1.1780
Trading recommendations:
The EUR / USD currency pair may resume its downward movement. The target for short positions now stands at 1.1536, as the indicator of Heikin Ashi turned down. The color of 1-2 bars in the purple color will signal about a new coil of the ascending correction.
The buy-positions are recommended to be opened only after the reverse fixing of the price above the moving with targets of 1.1658 and 1.1719. In this case, the initiative on the instrument will again pass into the hands of bulls.
In addition to the technical picture, one should also take into account the fundamental data and the time of their release.
Explanations for illustrations:
The upper channel of linear regression is the blue lines of unidirectional motion.
The lowest linear regression channel is the violet lines of unidirectional motion.
CCI - the blue line in the indicator window.
Moving average (20; smoothed) - the blue line on the price chart.
Levels of Murray - multi-colored horizontal stripes.
Heikin Ashi is an indicator that color bars in blue or purple.
The material has been provided by InstaForex Company - www.instaforex.com