AUD / USD pair
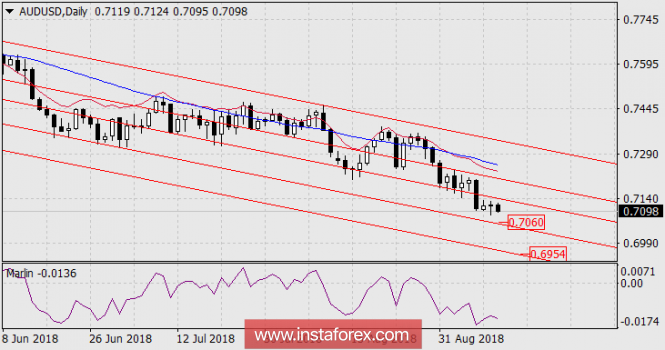
The Australian dollar is the only currency in Forex, which systematically moves according to clear rules of technical analysis from the end of August. After the price has gone under the balance line and the MACD line on the N4 chart, the decline continues without violating these lines.


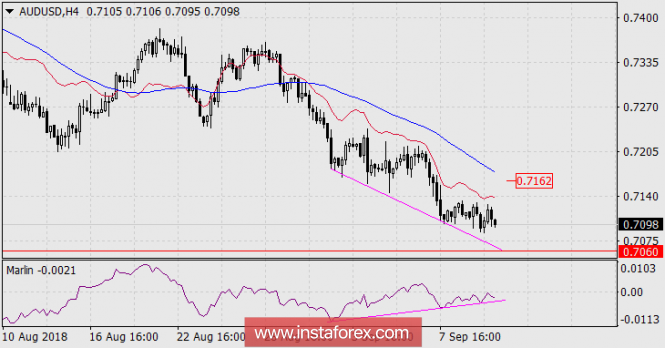
The immediate goal is to maintain the trend line on the daily chart at 0.7060. On the H4 chart, a double price convergence with Marlin oscillator was formed. From the designated level, a pronounced correction is possible, approximately to the MACD line at 0.7162 on 4-hour chart. The fastening at 0.7060 will allow the price to break the convergence and go down to the bottom line of the price channel at 0.6954 of the daytime timeframe.
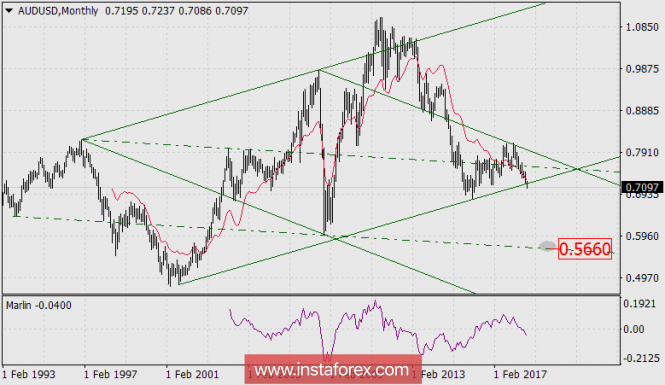
In addition, we placed a long-term forecast for the Australian dollar.

On the monthly chart, the price was fixed under the balance line indicator went under the lower line of the diamond. The signal line of the Marlin oscillator rapidly decreases in the negative zone. The prospect of reducing the indicator is very deep. The first significant goal can be the support of a trend-line (dash-dot line), which is a parallel midline of rhombus approximately in the area of 0.5660. The fall corresponds to our long-term forecast for the euro at 0.8518.
The material has been provided by InstaForex Company - www.instaforex.com