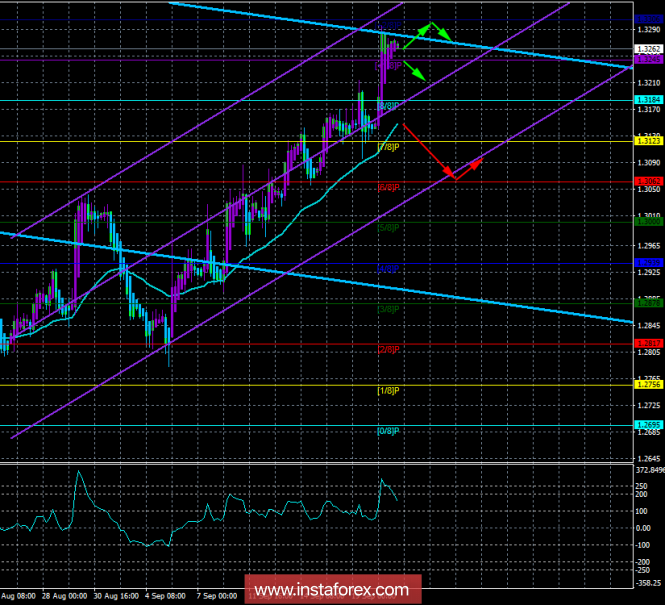
4-hour timeframe

Technical data:
The senior channel of linear regression: direction - down.
The younger channel of linear regression: the direction is up.
The moving average (20; flattened) is up.
CCI: 152.9145
The currency pair GBP / USD on Thursday, September 20, resumed the upward movement, and quite unexpectedly. No, from a technical point of view, everything is logical. An upward trend is maintained, there were no signs of its completion or a strong correction. But why did the movement intensify? Especially considering the fact that the price of Euro was also rising? It is unlikely that the report on UK retail sales, which turned out to be significantly better than expected by traders, could provoke the euro's growth. However, both European currencies strengthened yesterday. Thus, we are forced to connect this event with the EU summit, at which Brexit issues were discussed. And although, as the results of this summit showed, no fundamentally new agreements were reached, moreover, key issues remain unresolved, traders seem to believe that the matter is moving towards its logical conclusion in the form of a "soft" scenario for Britain's withdrawal from the EU. Otherwise, it is difficult to explain what is happening. On the last trading day of the week, the calendar of macroeconomic events in the UK is empty, while the states will publish insignificant preliminary values of business activity indexes in the services and production sectors. Thus, today, traders can begin to record profits on yesterday's long, which is likely to lead to the beginning of a downward correction.
Nearest support levels:
S1 - 1.3245
S2 - 1.3184
S3 - 1.3123
Nearest resistance levels:
R1 = 1.3306
Trading recommendations:
The currency pair GBP / USD resumed its upward movement. Today, a correction is expected, the Heikin Ashi turn down will confirm its start with the aim of moving the middle line. Overcoming the level of 1.3306 will serve as a signal for the opening of new purchase orders.
Sell-positions can be considered after securing the pair below the moving average line. However, this is unlikely to happen today, as the price is far enough from the moving-house.
In addition to the technical picture, one should also take into account the fundamental data and the time of their release.
Explanations for illustrations:
The upper channel of linear regression is the blue lines of unidirectional motion.
The junior channel is linear-violet lines of unidirectional motion.
CCI - the blue line in the regression window of the indicator.
Moving average (20; smoothed) - the blue line on the price chart.
Levels of Murray - multi-colored horizontal stripes.
Heikin Ashi is an indicator that color bars in blue or purple.
The material has been provided by InstaForex Company - www.instaforex.com