The US labor market is growing the fastest in history - last week, the markets got to know the results of the July report of the American Bureau of Labor Statistics regarding JOLTS surveys, which examine the number of open jobs, employment, layoffs and net changes in the overall market condition. The forecasts assumed that the number of open vacancies in July 2018 will amount to 6.646 million, ie slightly less than the previous publication (6.822 million revised positively from 6.662 million). The current reading at the level of 6.939 million was thus significantly better, not only from forecasts but also from the previous publication. It is also worth noting that this is the highest value of this indicator in the entire history of its quotations.
Producer prices in the US are falling for the first time this year - on Wednesday, we got to know the latest results of the American PPI index. As it turned out, August brought an unexpected drop in the value of the US PPI. The producer price index is down 0.1% on a monthly basis after it registered no change in July, the US Department of Labor reports. In annual terms, the index recorded an increase of 2.8% after it rose by 3.3% in July. The economists surveyed by Reuters expected the PPI to increase in August by 0.2% (3.2%) on a monthly (annual) basis.
The oil inventories are contracting for the fourth week in a row - as every Wednesday afternoon, the market participants also got to know the reports of the American Energy Information Administration (EIA) regarding crude oil stocks on the local market. It shows that after a week-last fall of 4.302 million zlotys, in the week ending September 7, 2018, crude oil inventories contracted by as much as 5.396 million zlotys, which turned out to be more than four times better than forecasts for a drop of 1,300 million barrels.
American claims the lowest since 1969 - according to the Department of Labor report published on Thursday, the number of jobless claims in the week ending September 8 was 204,000, which is lower by as much as one thousand from the revised upturn from the previous week (205,000). What is important was the lowest number of new applications for benefits from December 6, 1969, when it amounted to 202,000.
CPI inflation in monthly terms increases by 0.2% - at the same time, we also got to know the July CPI reading in monthly terms, which was at the level of 0.2%. Economists assumed that in June it would rise to 0.3%, but the hopes were not met. Consumer inflation in June increased only by 0.2%, as in the previous reading. On a year-to-year basis, the CPI decreases to 2.7%, thus lower than analysts' forecasts (2.8%) and the previous publication (2.9%).
Retail sales below expectations - according to information provided by the American Census Bureau, the value of the basic retail sales m / m increased in August this year. only by 0.3%, which turned out to be a result much worse than the previous publication (0.9%), as well as from the already no highest forecasts (0.5%). On the other hand, the full retail sales index is even worse, which despite the forecasts assuming an increase of 0.4%, eventually increased by only 0.1%.
Consumer mood in the US at the highest since March this year - on Friday, the markets also met the preliminary reading of the University of Michigan index for August this year. The index itself is based on telephone surveys that are conducted on a representative group of 500 US households. They ask for both an assessment of the current economic conditions and expectations as to the future. The consensus before this publication assumed a slight increase in the ratio value to 96.7 from 96.2 previously. However, as it turned out, the purchasing potential of American consumers seems to be significantly better now, as the result achieved at 100.8 is the best result since March this year.
In conclusion, the US economy under the Trump administration is developing very well, at least according to the official data. This macroeconomic environment is creating a good opportunity for the US Dollar to appreciate in the short and the long-term across the board.
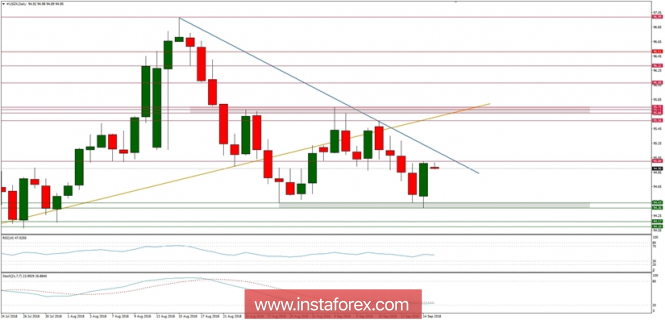
Let's now take a look at the US Dollar Index technical picture at the daily time frame. The market has made an interesting Bullish Engulfing candlestick pattern while the price bounced from the support at the level of 94.36. The local high was made at the level of 95.00 and there is still a chance for another move up as the market conditions are still oversold. Any violation of the blue trend line will be considered bullish and in that case, the next target will be at the level of 95.56 and then 95.75.

