At the end of June, we published a forecast for gold called "is it worth investing in gold?" (See). After 8 weeks, when the price fell to the first target of 1200, the forecast was fulfilled in its first part. Now it is time to consider further prospects.

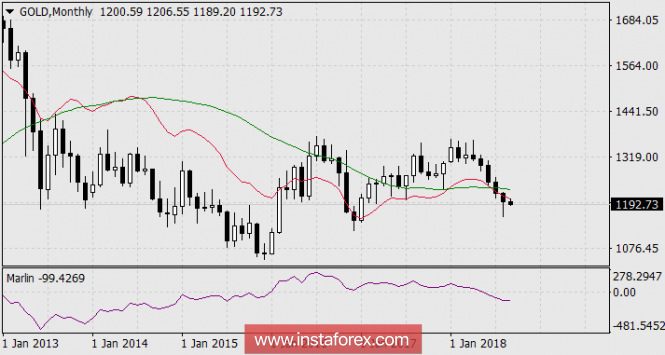
To begin with, a small but important note on the monthly chart - the price was fixed under the balance line and MA50 green. It would be more interesting to look at the indicator of the Kruzenshtern trend line, but the fact is that more than 600 bars are needed to build this line, and there are fewer of them on the monthly chart. But with some approximation, the moving average with a period of 50 resembles the Kruzenshtern line. Here the price is below 50 MA, and it can be assumed that the price is also below Kruzenshtern. But even in itself, fixing the price under MA 50 of such a high scale is a strong signal for the medium - and long-term decline. The signal line of the oscillator Marlin is reduced in the territory of possession of bears.

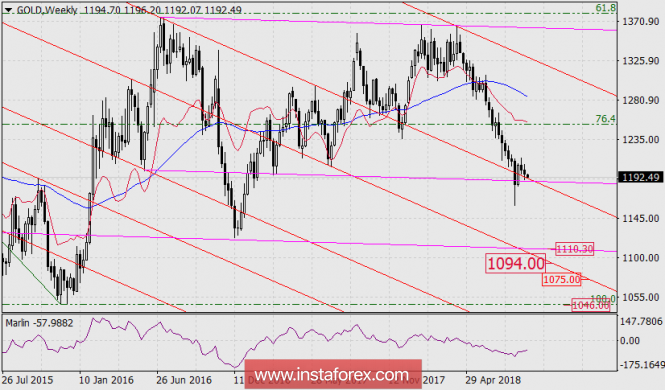
The schedule of the weekly timeframe are supplemented with pink specifying trend lines. At the moment, the price is testing one of them. Overcoming this line opens the prospect of a decline to the lower line in the area of 1110.30. Then the next target is the red support trend line in the area of 1094.
If the current consolidation continues above the trend lines, the targets will decrease slightly according to the slopes of these lines – pink and red. Moreover, the red line has a steeper descent, and this can significantly reduce the prospect of the expected decline (as an option, 1075 – the December 2009 low).
The material has been provided by InstaForex Company - www.instaforex.com