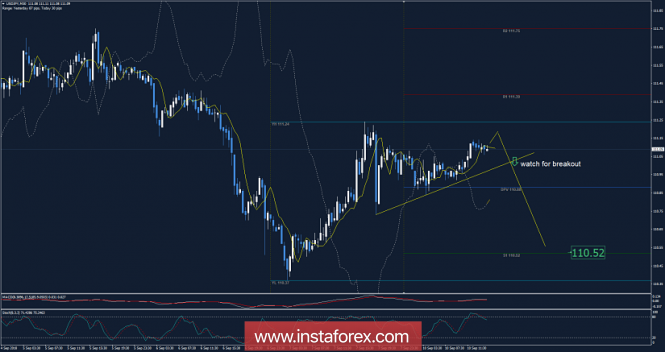
Recently, the USD/JPY has been trading sideways at the price of 111.10. Anyway, according to the M30 time frame, I found that price is trading near the resistance level (Friday's high) at the price of 111.24, which is a sign that buying looks risky. I also found strong supply in the background and overbought condition on the stochastic oscillator, which is another sign of weakness. Watch the breakout of the support trendline to confirm further downward movement. The downward target is set at the price of 111.52.
The material has been provided by InstaForex Company - www.instaforex.com