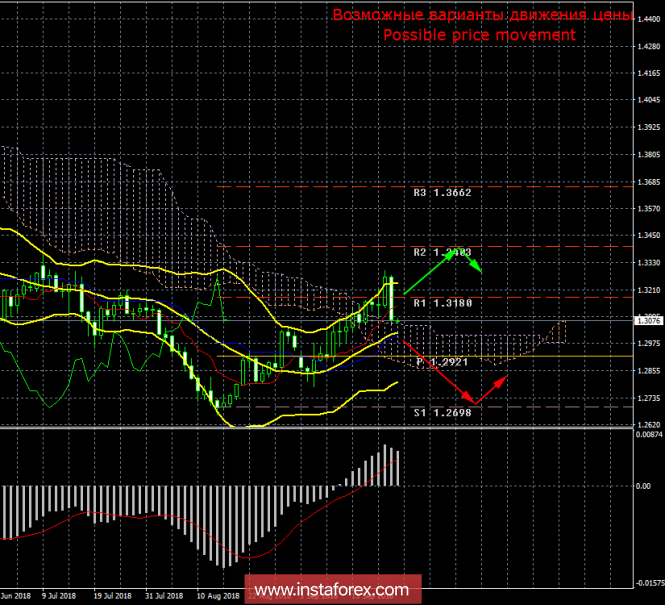
24-hour timeframe

Last week's review, we wrote that for a pair of GBP / USD and now, almost everything depends on the progress of negotiations on Brexit. Over the past week, traders first received a very dubious signal that Brexit talks are moving forward, and there is a high probability that they will end in success. However, the next day, market participants realized that in fact there is no official information on this issue, and the parties have not yet been able to agree on key issues. Moreover, the new proposal by Theresa May on the terms of the "deal" was rejected by the EU. She herself later delivered an ultimatum to Parliament, whereas either politicians will accept her Brexit variant, or in general, there will be no deal with the EU. Representatives of the Conservative Party are preparing the proposal of Theresa May about resignation in April 2019, that is, after the official withdrawal of the country from the EU. Thus, it is the fall of the pound sterling in the last trading day of the past week that looks quite logical, and not the previous growth.
Only on Friday, the report on GDP for the second quarter will be published. However, we draw attention to a sufficient number of reports in the States, and it is also recommended not to forget to track any news related to Brexit or the situation around Theresa May. This news can have a strong impact on the movement of the currency pair. For this week in the UK, there will be practically no plan for macroeconomic reports.
Trading recommendations:
The GBP / USD currency pair begins to be adjusted against the "golden cross". Thus, it is recommended to wait until the correction is completed in order to resume trading on the rise. The first target for Longs is the second resistance level of 1.3403.
It is recommended to open short positions in the long term only after fixing the price below the critical line (1.3010), which will mean a change in the direction of the trend. In this case, the first target for the sell orders will be the support level of 1.2698.
In addition to the technical picture, one should also take into account the fundamental data and the time of their release.
Explanations to the illustration:
Ichimoku Indicator:
Tenkan-sen is a red line.
Kijun-sen is a blue line.
Senkou Span A is a light brown dotted line.
Senkou Span B - a light purple dotted line.
Chikou Span is a green line.
Bollinger Bands Indicator:
3 yellow lines.
MACD indicator:
Red line and histogram with white bars in the indicator window.The material has been provided by InstaForex Company - www.instaforex.com