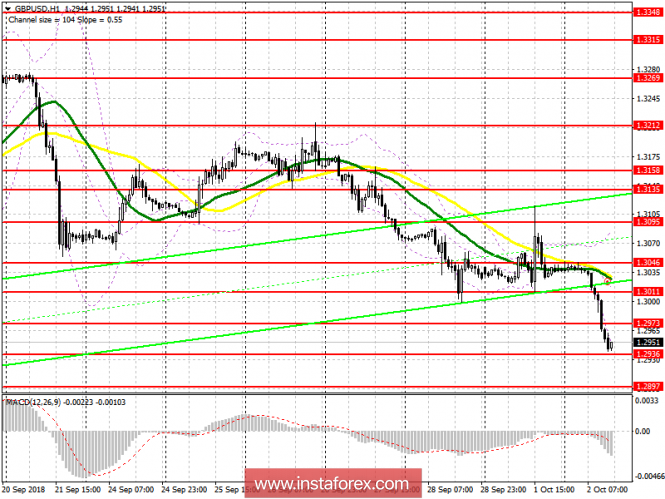
For you GBP / USD pair, you need:
The expected breakthrough of the support level at 1.3011, which I drew attention to in my morning review, led to the sale of the pound. At the moment, buyers are trying to keep above the level of 1.2936, but the upward correction that we are seeing in this range is only a short-term profit taking on short positions. For a more sustainable growth, buyers in the second half of the day need to return in the resistance of 1.2973, which will lead to an update of the maximum at 1.3011, where fixing profits are recommended. In the event of a further fall of the pound on the repeated test of the support at 1.2936, long positions can be returned to the rebound from the minimum of 1.2897 and 1.2872.
To open short positions on GBP / USD pair you need:
Sellers cope with the challenge of breaking through the support at 1.3011 which led to the sale of the pound and the updating of new local minima. At the moment, it is best to return to short positions after an unsuccessful correction in the area of resistance at 1.2973 or to rebound from a high of 1.3011. The main task will be the repeated test of support at 1.2936, after which the pressure on GBP / USD will increase again, which will lead to a decrease in the new minimums at 1.2897 and 1.2872, where fixing profits are recommended.
Indicator signals:
Moving averages
Despite the large decline in the pound and the direction of the moving average, it is important to note that both MA are at the same level with each other, which in the short term can play on the side of the pound buyers and lead to its upward correction.
Bollinger bands
The indicator Bollinger Bands indicates a surge in volatility and the further formation of a downtrend on the pound.

Description of indicators
- MA (moving average) 50 days - yellow
- MA (average sliding) 30 days - green
- MACD: fast EMA 12, slow EMA 26, SMA 9
- Bollinger Bands 20
