To open long positions for GBP / USD, you need:
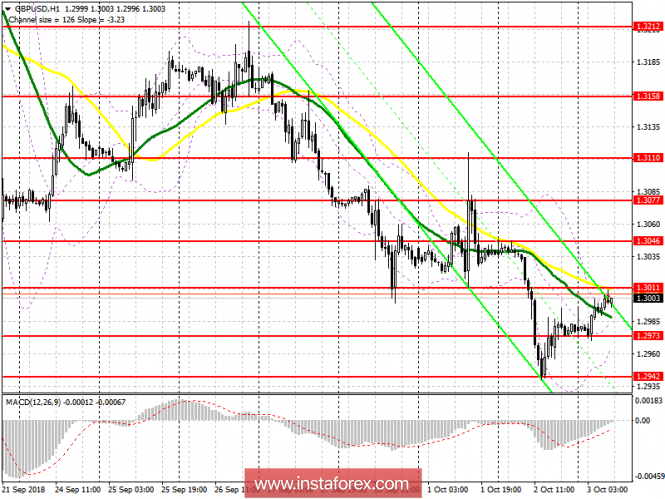
Further upward movement in the pound will directly depend on the PMI data on the UK services sector. If the data indicates an increase in activity, a breakthrough of the resistance level of 1.3011 will be a good signal to buy the pound in order to update the highs of 1.3046 and 1.3077, where I recommend fixing the profits. A similar situation will occur with the formation of a false breakdown in the support area of 1.2973. In the case of a large drop in the pound on the data, it is best to return to purchases on a test of 1.2942 minimum, or even to a rebound from 1.2897.
To open short positions for GBP / USD, you need:
The pound sellers will expect a false breakdown and a return below the resistance level of 1.3011, and the expected slowdown in the UK services sector may lead to a larger downward trend with a break of the support level of 1.2973, below which the pound will fall to the minimums of 1.2942 and 1.2897, where I recommend fixing the profits. In the case of GBP / USD growth in the first half of the day above 1.3011, I recommend to take a closer look at short positions from the resistance level of 1.3046 or sell the pound to rebound from a high of 1.3077.
Indicator signals:
Moving Averages
The price has moved above the 30-day and 50-day moving average, which indicates the formation of an upward correction. As long as trading will be above average, the demand for the pound will continue.
Bollinger bands
Bollinger Bands indicator volatility decreases before the release of important data. The break of the upper border of the bands with around 1.3010 will be a signal to the new wave of growth in GBP / USD.

Description of indicators
MA (average sliding) 50 days - yellow
MA (average sliding) 30 days - green
MACD: fast EMA 12, slow EMA 26, SMA 9
Bollinger Bands 20
The material has been provided by InstaForex Company - www.instaforex.com