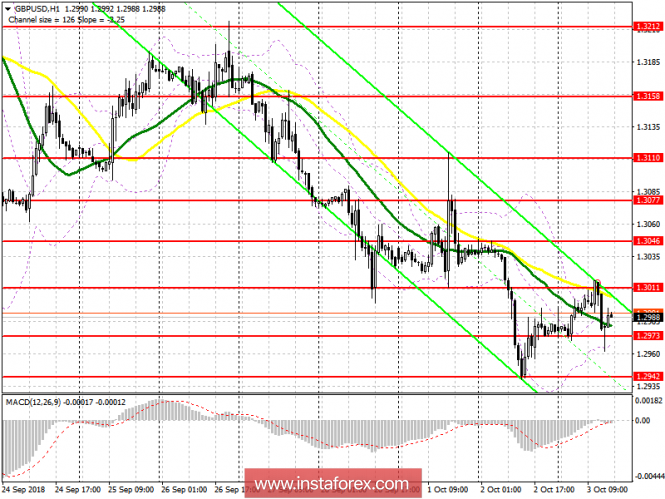
To open long positions for GBP/USD, it is required:
Buyers could not catch hold of the resistance level of 1.3011 after the release of a weak report on activity in the UK services sector, which led to a decrease and update of the support level of 1.2973, which I drew attention to in my morning review. At the moment, while trading is above 1.2973, buyers still have a chance to repeat the test of resistance at 1.3011 and its breakdown, which will lead to a new rising wave in the GBP/USD pair with an update of the high of 1.3046, where I recommend profit taking. In case the pound further declines, you can return long positions to a rebound from the low of the week 1.2942.
To open short positions for GBP/USD, it is required:
Sellers lacked one test of the support level of 1.2973, but it is clear that there is no activity among buyers as well. The repeated decline in the area of 1.2973 will be a good signal for opening new short positions in the GBP/USD pair in order to decrease to the lows of the week in the area of 1.2942 and update 1.2897, where I recommend to lock in the profit. In case of growth above 1.3011, short positions can be returned immediately to the rebound from the resistance of 1.3046.
Indicator signals:
Moving averages
The pair is stuck between the 30 and 50-day average, which indicates some confusion with the further direction of the market.
Bollinger Bands
The Bollinger Bands indicator continues to indicate low market volatility, which is beneficial for sellers who can resume pressure on the pound after a small correction.

Indicator description
- Moving Average (average sliding) 50 days - yellow
- Moving Average (average sliding) 30 days - green
- MACD: fast EMA 12, slow EMA 26, SMA 9
- Bollinger Bands 20
