A hope for another shockingly good Amazon results, went into oblivion when the report of the second most important company in the world appeared yesterday. Although the consensus level was traditionally beaten at the level of profits, the investors turned out to be worse than the analysts' expectations, which means that they turned out to be much worse than the real market expectations. The key, however, was their forecast presented by the company for the most important Christmas fourth quarter. Even its upper limit is lower than the number expected. A significant disappointment was the Alphabet (Google)earnings report, which also lurked the revenue side. There are many indications that we have reached the point where the sales dynamics of the American titans of the technology sector will inevitably fall, although they still remain at clearly two-digit levels. While in the case of a more reasonably priced Alphabet, this does not necessarily mean a very deep discount, the ratio of Amazon's share prices to its profits is at three-digit levels, which are justified only for companies that can grow at a tremendous pace for at least a few consecutive years. It is too early to say that the era of absolute domination of technology companies is over, but there are grounds to expect a further correction of their prices, both in nominal and relative terms.
Sentiments do not improve data on US GDP. The increase dropped to annualized 3.5% q / q (vs. 4.2% q / q in 2Q2018), which is a slightly better result than the consensus (3.3% q / q). The shadow on this figure is put to a surprisingly low GDP deflator, which three months ago was 3.0% q / q and currently 1.7% q / q (consensus: 2.1% q / q). The growth structure also does not impress despite strong consumption. The largest increase since the beginning of 2015 had a big positive impact. Weak investment, the trade balance looks very bad (although it may be a one-off effect, triggered by a trade war, which affects the growth of imports before the introduction of duties and weakens exports). At the moment this is secondary - an extremely good reading could also frighten the market as an argument for FOMC for further rate increases.
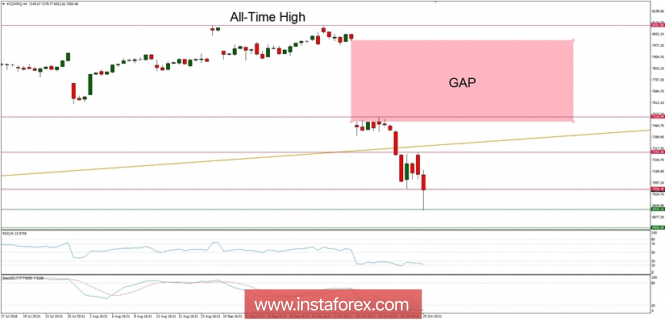
Let's now take a look at the NASDAQ technical picture at the H4 time frame. The market has bounced from the technical support at the level of 6926, but did not increase much as the price was capped again at the technical resistance at the level of 7055. In a case of further drops, the next technical support is seen at the level of 6808. In the case of a more stronger bullish correction, the next important technical resistance is seen at the level of 7292. The market conditions are now extremely oversold and the momentum remains very weak.

