Technical outlook:
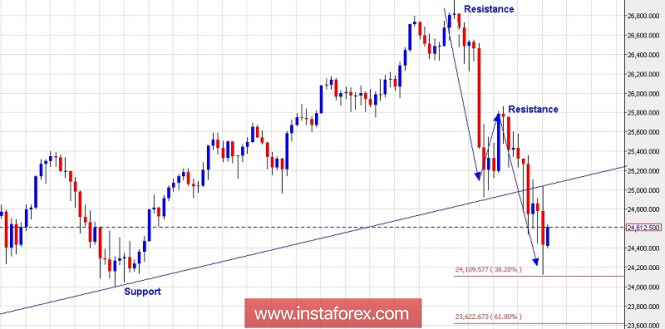
The daily chart view for Dow Jones has been depicted here for a medium-term outlook. It is clear that a meaningful top is in place at 26,950/60 levels earlier and that the index has been dropping vigorously since then, forming lower lows and lower highs. Besides, note that Dow Jones almost hit its fibonacci 0.382 extension of the swing between 26,950 and 24,918 levels respectively. Ideally a corrective rally should begin soon towards sub 25800 levels either from current levels or from the fibonacci 61.8 extension at 23,600 levels. In any case, Dow Jones remains an excellent asset to remain short. Consider sell positions on intraday/interday rallies through 25,800 levels.
Trading plan:
Sell around 25,800 levels, stop 26,950, target open.
Good luck!
The material has been provided by InstaForex Company - www.instaforex.com