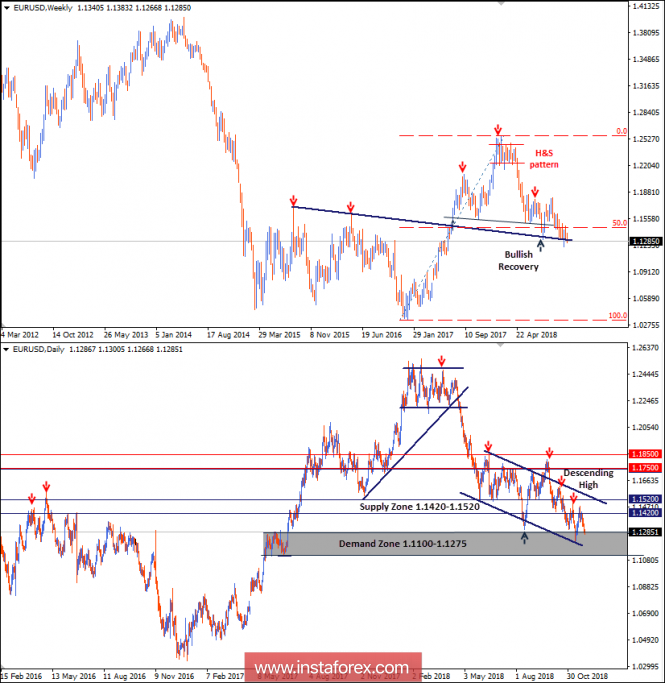
On the weekly chart, the EUR/USD pair is demonstrating a high-probability Head and Shoulders reversal pattern where the right shoulder is currently in progress.
On the Daily chart, the pair has been moving sideways with slight bearish tendency. Recent bearish movement is maintained within the depicted daily movement channel.
On November 13, the EUR/USD demonstrated recent bullish recovery around 1.1220-1.1250 where the lower limit of the channel as well as the depicted demand zone came to meet the pair.
Quick bullish advancement was demonstrated towards 1.1420. To be noted that prominent supply zone as well as the previous wave high are located around 1.1420-1.1520.
Bullish fixation above 1.1420 was needed to enhance further bullish movement towards 1.1520. However, the market demonstrated significant bearish rejection (shooting-star weekly candlestick).
The EUR/USD pair remains under bearish pressure below 1.1420. The nearest demand level to meet the pair is located around 1.1170 where the lower limit of the depicted channel is roughly located.
A quick decline was expected towards 1.1270 and probably the price zone of 1.1170-1.1150 would be visited soon if early bearish breakout below 1.1270 is achieved on lower timeframes.
The material has been provided by InstaForex Company - www.instaforex.com