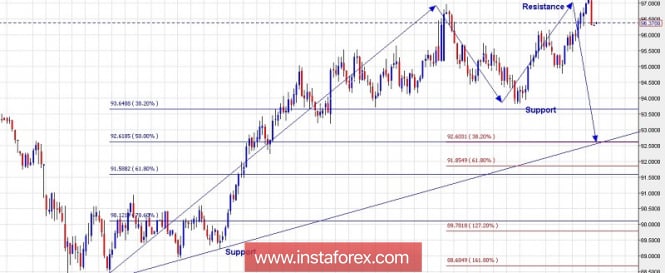
Technical outlook:
The daily chart has been depicted here for understanding the larger picture for US Dollar Index. As seen here, the rally between 88.30 and 97.00/20 levels can be considered to be the first major swing. After this, the most probable outlook should be a counter-trend drop towards 93.00 levels as shown here. The US Dollar Index might have already resumed its drop lower yesterday, after printing highs at 97.20 levels and producing an engulfing bearish candlestick pattern as well. A high probability move should be lower from here, towards 93.00 and 92.50 which is fibonacci 50% of the entire previous rally. A price break below 95.00 levels would be encouraging to bears going forward. Bears are expected to be in control, till prices stay below 97.20 levels going forward.
Trading plan:
Short against 97.20 with target below 93.00
Good luck!
The material has been provided by InstaForex Company - www.instaforex.com