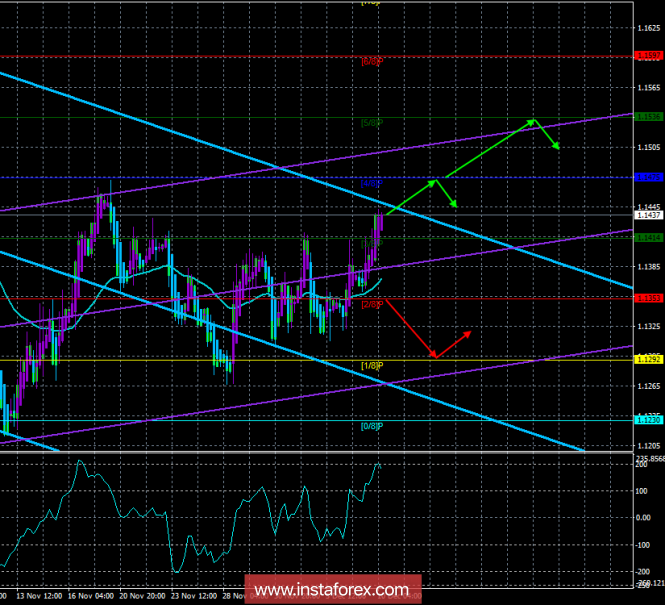
4-hour timeframe

Technical details:
The senior linear regression channel: direction - down.
The younger linear regression channel: direction - up.
Moving average (20; smoothed) - up.
CCI: 179.2206
The currency pair EUR / USD on Monday, December 10, continues a rather strong upward movement, which began on Friday. On the last trading day of last week for the US dollar, everything could have ended more safely if traders paid attention to the report on GDP in the eurozone, which turned out to be 0.1% weaker than the forecast value and the previous value in the third quarter. However, in the afternoon, American macroeconomic statistics also fell through. The most disappointing is the number of new jobs created outside the agricultural sector - 155,000 (the forecast is 200,000, the previous value is 255,000). It was this report that most influenced the desire of traders to sell the US dollar. Reports on the unemployment rate and the change in the average hourly wage were fully in line with forecasts and therefore had an indirect impact on the course of trading. However, the latest strengthening of the European currency over the past week gives hope to traders that the downtrend may finally be completed. Of course, we would not be in a hurry with such conclusions, especially on the eve of the announcement of the results of the European Court on Article 50 of the Lisbon Treaty (today) and the vote on Brexit in the UK Parliament (tomorrow).
Nearest support levels:
S1 - 1.1414
S2 - 1.1353
S3 - 1.1292
Nearest resistance levels:
R1 - 1.1475
R2 - 1.1536
R3 - 1.1597
Trading recommendations:
The currency pair EUR / USD continues to move up. Thus, now remain relevant long positions with a target of 1.1475. Turning the Heikin Ashi indicator down will signal a manual reduction of long positions.
It is recommended to open sell orders if traders overcome a moving average line and Murray's level of "2/8". In this case, the pair may return to the formation of a downtrend.
In addition to the technical picture, you should also consider the fundamental data and the time of their release.
Explanations for illustrations:
The senior linear regression channel is the blue lines of the unidirectional movement.
The younger linear regression channel is the purple lines of the unidirectional movement.
CCI - blue line in the indicator window.
The moving average (20; smoothed) is the blue line on the price chart.
Murray levels - multi-colored horizontal stripes.
Heikin Ashi is an indicator that colors bars in blue or purple.
The material has been provided by InstaForex Company - www.instaforex.com