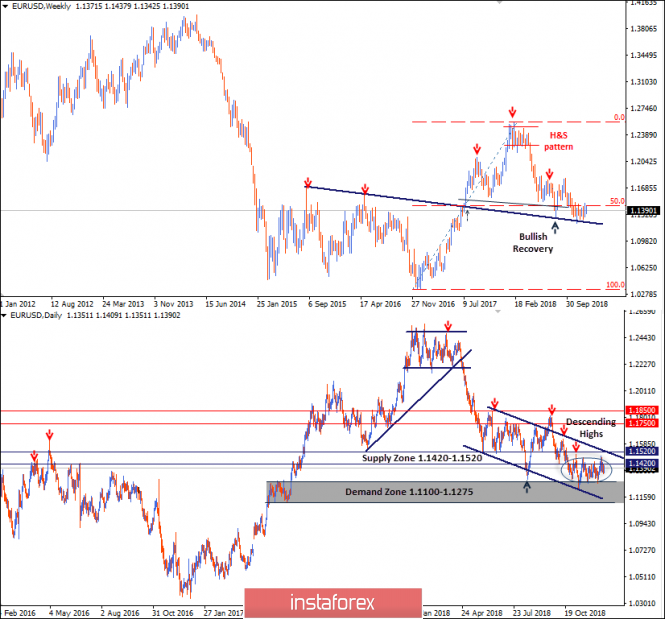
On the weekly chart, the EUR/USD pair is demonstrating a high-probability Head and Shoulders reversal pattern where the right shoulder is currently in progress.
On the daily chart, the pair has been moving sideways with a slight bearish tendency. Narrow sideway consolidations have been maintained within the depicted daily movement channel since June 2018.
On November 13, the EUR/USD pair demonstrated bullish recovery around 1.1220-1.1250 where the lower border of the channel as well as the depicted demand zone came to meet the pair.
Bullish fixation above 1.1420 was needed to enhance further bullish movement towards 1.1520. However, the market demonstrated significant bearish rejection around 1.1420 a few times.
Recently, the EUR/USD pair has been trapped between the price levels of 1.1420 and 1.1270 waiting for a breakout since November 5.
On Friday, based on recent price action, another bearish engulfing daily candlestick was demonstrated around the price level of 1.1420. This enhances the bearish side of the market towards 1.1270 (lower limit of the congestion zone) in the short term.
The material has been provided by InstaForex Company - www.instaforex.com