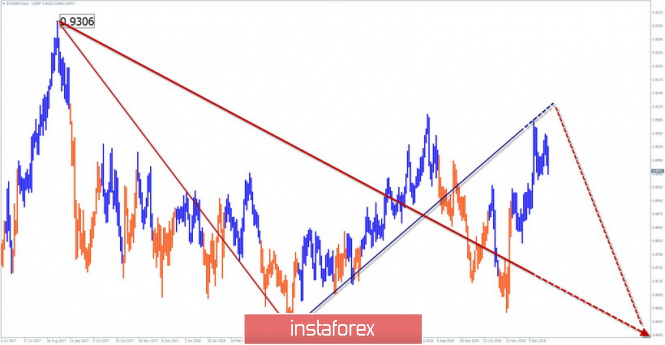
Since April of this year, the price fluctuations of the cross form an ascending standard plane. Judging by the structure, the model has entered the final phase.

Medium scale graphics:
The bullish wave of November 13th is developing in a pulse type. In a larger wave, the site took the place of the final part (C).
Small scale graphics:
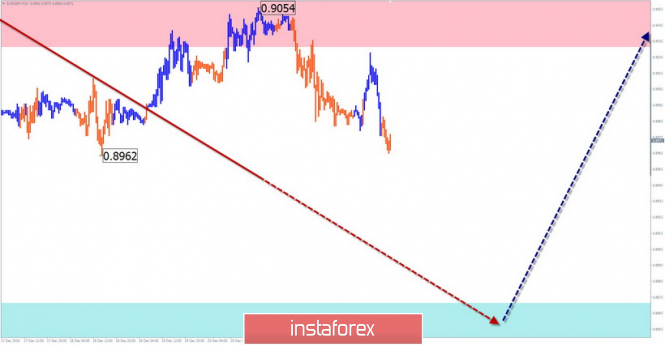
Since December 10, the price forms a descending area. In the H1 wave, it will become a correction (B), therefore the nature of the movement is predominantly flat, and the scope of the expected decline is minimal.

Forecast and recommendations:
Expected in the coming days, the depreciation of the pair goes against the direction of the trend of the main wave, so sales are not recommended. In the area of settlement support, it is worth looking at the reversal signals to enter long trades.
Resistance zones:
- 0.9030 / 0.9080
Support areas:
- 0.8870 / 0.8820
Explanations to the figures: The simplified wave analysis uses waves consisting of 3 parts (A – B – C). For analysis, 3 consecutive graphs are used. Each of them analyzes the last, incomplete wave. Zones show calculated areas with the highest probability of reversal. The arrows indicate the wave marking by the method used by the author. The solid background shows the formed structure, the dotted - the expected movement.
Attention:
The material has been provided by InstaForex Company - www.instaforex.com