Technical outlook:
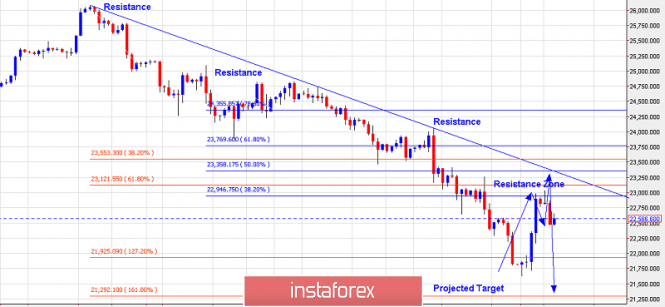
The Dow Jones has been on a free fall since 26,000 levels, that was hit on December 03, 2018. A 4-hour chart view has been presented here with immediate trend line and projected fibonacci ratios for the short-medium term outlook. As highlighted here, the first 3 fibonacci targets have been hit already at 23,550, 23,120 and 21,900 levels respectively; before the index turned higher from 21,800 levels yesterday. Please note that the current rally could prove to be corrective/counter trend rally and the indice could reverse lower towards the next fibonacci target at 21,300 levels as highlighted on the chart here. Also note that projected resistance zone according to fibonacci resistance and downtrend line is seen around 23,300/400 levels. Ideally, bears should regain control back around that levels and resume the down trend.
Trading plan:
Look to sell around 23,300/400, stop at 24,000, target 21,300
Good luck!
The material has been provided by InstaForex Company - www.instaforex.com