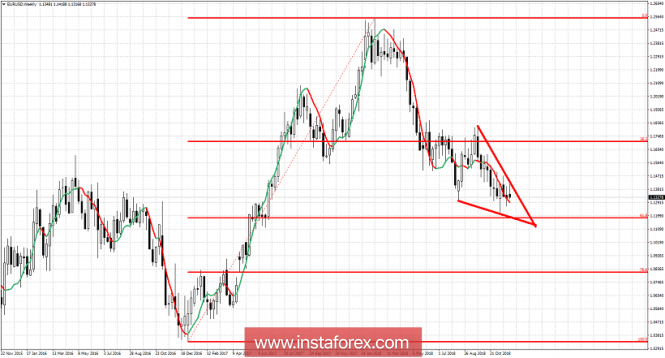
EUR/USD showed strength early in the day yesterday but at the end of the day the break out above 1.14-1.1420 was gone and prices were challenging and breaking below daily lows. This reversal and fake breakout is a bearish, but as long as price holds above 1.13 bulls still have hopes.

Today we take a look at the weekly chart of EUR/USD. The decline that started at 1.2550 has stopped at the 61.8% Fibonacci retracement. Recent weekly price action shows a falling wedge formation. Price remains trapped inside the boundaries of the wedge and as long as there is no break out to the upside, a move to new short-term lows towards 1.12 are very possible. Breaking and closing above 1.14-1.1420 would be a break out signal and a bullish sign implying that the entire downward move from 1.2550 might be complete. Longer-term trend remains bearish from 1.2550 and will change only with the break out of the wedge pattern. The 61.8% Fibonacci level offers a great level for a reversal. So far we have seen a bounce from 1.1215 to 1.1475 but still inside the boundaries of this pattern. Bulls will need to break above 1.1475 for a confirmation of the breakout.The material has been provided by InstaForex Company -
www.instaforex.com

