Trading recommendations:
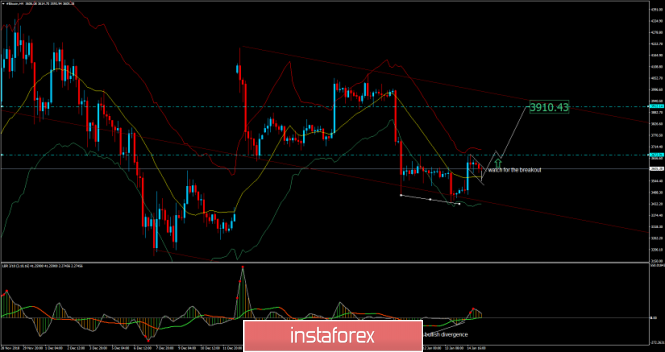
According to the H4 time - frame, I found that BTC created a potential double bottom pattern, which is a sign that selling looks risky. I have also found that therer is the bullish impulsive wave in the background and hidden bullish divergence on the LBR oscillator, which is another sign of the potential strength. My advice is to watch for buying opportunities if you see breakout of the potential bullish flag. The breakout of the $3.672 would confirm potential test of $3.910.
Support/Resistance
$3.670 – Intraday resistance
$3.440– Intraday support
$3.910 – Objective target
With InstaForex you can earn on cryptocurrency's movements right now. Just open a deal in your MetaTrader4.
The material has been provided by InstaForex Company - www.instaforex.com