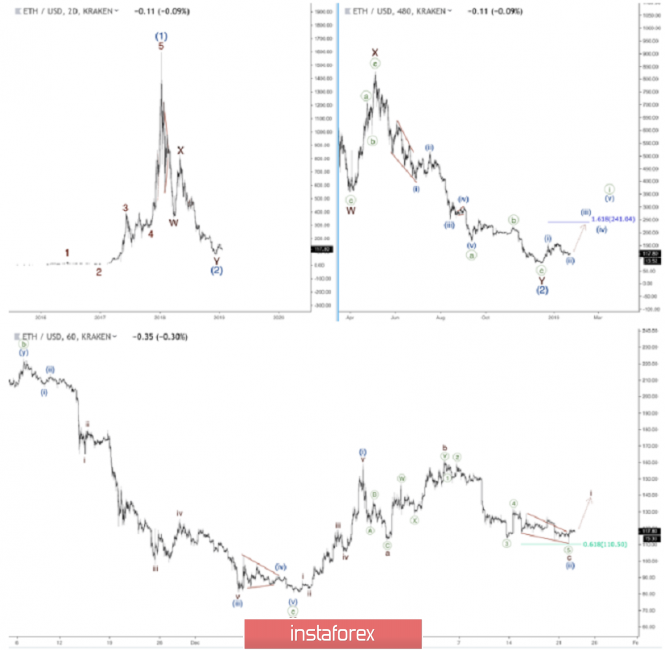
As you can see on the two-day chart, there's a huge bearish double zigzag pattern, which could be wave (2). Previously, we had a massive bullish rally in impulsive wave (1). Also, we've got a finished zigzag in wave Y of (2), as shown on the 480-minute chart on the right. In this case, we're at the early stages of another bullish trend.
The last upward price movement is likely the first wave of wave ((i)). Considering a possible ending of the second wave, we should keep an eye on the 1.618 multiple of wave (i) at 241.04 as the nearest target for wave (iii) of ((i)). Meanwhile, it's worth to mention that if the price goes through this level little later on, there'll be a green light for a longer extension in wave (iii).
Wave ((c)) of Y has finished as an impulse with an extension in the third wave, resulting in a developing of a five-wave advance in wave (i). As we can see on the chart above, this price movement subdivides into five waves, which labelled as i-ii-iii-iv-v. Then, a bearish correction took place.
It's likely that wave (ii) has ended as a flat pattern. There're a zigzag in wave a and a double zigzag in wave b. Finally, a bearish impulse in wave c with an ending diagonal pattern in wave ((5)) finished this structure. Also, the 0.618 retracement of wave (i) at 110.50 has acted as support, so there's a pullback from this level, which provides strong evidence of the ending of wave (ii). Under these circumstances, we're going to have the first wave (labelled as i) of wave (iii) in the coming hours.
The material has been provided by InstaForex Company - www.instaforex.com