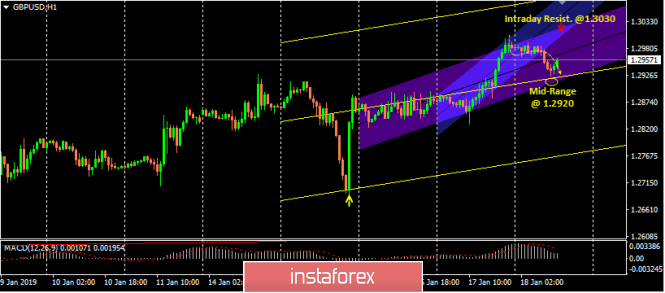
Blue channel is based on the price movement of yesterday.
Violet channel is based on the previous two-day consolidations.
Yellow channel is based on the previous three-day consolidations.

The recent bullish movement of the GBP/USD pair which started around 1.2700, has lost much of its bullish momentum since Wednesday.
Lack of enough bullish momentum is demonstrated on the chart so that Today's recent movements have turned into sideways consolidations.
The pair is currently moving within the depicted narrow channel (Violet channel) after a bearish breakout of the BLUE channel was demonstrated earlier today.
Looking to the downside, the GBP/USD pair has an Intraday support located around 1.2900 which corresponds to mid-range of the yellow channel.
Any bearish pullback towards 1.2900 can be considered for a short-term BUY position.
On the other hand, any decline below 1.2900-1.2880 (Mid-Range Support) enables a deeper decline towards 1.2830 and 1.2780 where the lower limit of the yellow channel is located.
Having a look to the upside, the GBP/USD pair has a key-resistance zone around 1.3020 where bearish rejection may be anticipated.
That's why, obvious bullish breakout above 1.3020 is mandatory for BUYERS to pursue towards 1.3080-1.3100.
The material has been provided by InstaForex Company - www.instaforex.com