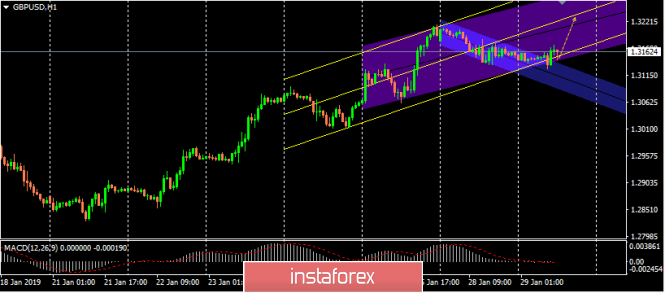
Blue-channel is based on the price movement of Yesterday.
Violet-channel is based on the previous two-days consolidations.
Yellow-channel is based on the previous three-days consolidations.

Lack of enough bullish momentum was demonstrated on the depicted chart so that Today's recent movement has been going into sideways consolidations.
The pair is currently moving within the depicted Violet channel (Two-Days movement) after bullish breakout of the BLUE channel was demonstrated few hours ago.
This enhances the bullish side of the market on the short-term provided that no bearish decline occurs below the daily low around 1.3128.
Projected bullish target is located around 1.3215 where the mid-range of the depicted Yellow channel is located.
Bullish fixation above 1.3215 expands the bullish potential towards 1.3280 where the upper limit of the Yellow channel is located.
On the other hand, When we Look to the downside, the GBP/USD pair has an Intraday support located around 1.3080 which corresponds to lower limit of the BLUE channel.
This level would be the 1st bearish destination in case a bearish breakdown below the daily low (1.3128) takes place.
The material has been provided by InstaForex Company - www.instaforex.com