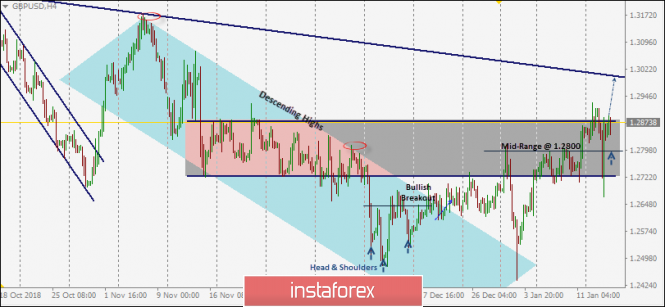
Since Mid-November, Successive Lower Highs were demonstrated around the price levels of 1.3060, 1.2920 and 1.2800 maintaining movement within the depicted H4 bearish channel (The Blue one).
Shortly after, a quick bearish decline was demonstrated towards the price level of 1.2500 where bullish recovery (Bullish Head & Shoulders pattern) could take place on December 12.
Hence, a successful bullish breakout above the depicted bearish channel was demonstrated on December 24.
On December 31, early bullish breakout attempt above 1.2720 was demonstrated on the H4 chart. However, the market failed to maintain sufficient bullish momentum above 1.2800 (mid-range of the depicted consolidation range).
Last week, another bullish breakout above 1.2720 was attempted to resume the bullish scenario of the market aiming towards 1.2800, 1.2880 and 1.3000.
Bullish persistence above 1.2800 (Mid-Range) is mandatory for buyers. Any decline below 1.2800 invalidates the bullish scenario bringing the GBP/USD pair again into sideway consolidations that may extend down towards 1.2720 (Lower limit of the depicted consolidation range).
On the other hand, the price level of 1.2880 stands as an intraday key-resistance corresponding to the upper limit of the previous consolidation zone (1.2720-1.2880).
Strong bullish breakout above 1.2880 is mandatory for Buyers as a valid BUY signal to look for further bullish advance towards 1.3020 where the depicted downtrend (in Blue) comes to meet the GBP/USD pair.
The material has been provided by InstaForex Company - www.instaforex.com