Technical Outlook:
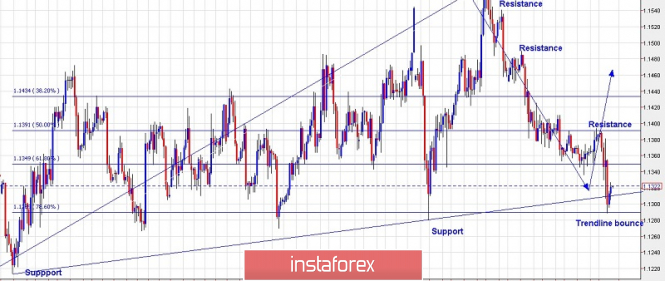
We have presented a 4-hour chart view for the EUR/USD pair since November 13, 2018 to have a bigger picture. Please note that the support trend line connecting lows of November 13, 2018 and January 03, 2019 has been tested, while the prices have broken through the 1.1290 levels. Also note that prices have bounced off the fibonacci 0.786 support level, the entire rally between the levels of 1.1300 and 1.1569, respectively. Furthermore, the wave structure could be depicted as the entire rally which was retraced lower in a complex correction towards the 1.1290 level yesterday. Immediate support is seen at 1.1270, followed by the 1.1217 level, while resistance is seen at the level of 1.1391, respectively. With the above evidence, we can conclude now that bulls will stay with the game till the prices are mainly above the 1.1217 levels.
Trading plan:
Remain long with the stop at 1.1213 and the target at the 1.1800/20 levels.
Good luck!
The material has been provided by InstaForex Company - www.instaforex.com