Technical outlook:
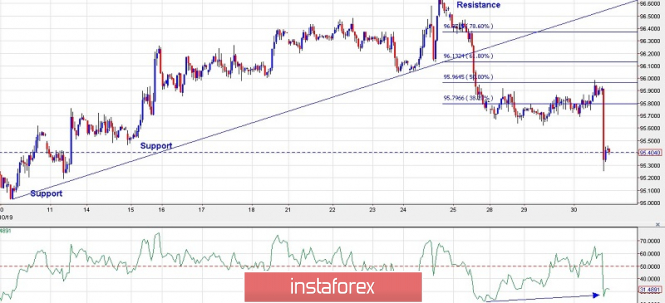
The hourly chart depicted here for the US Dollar Index is indicating a bullish divergence on the RSI at this point in time. As discussed earlier, yesterday's drop was expected from the 96.30 levels but the US Dollar Index reversed lower after producing a shallow retracement towards the 96.00 levels. In the process, bears have taken out another support at the 95.50 levels as seen here. Now we should wait for a minimum retracement/pullback towards the 95.80/96.00 levels to initiate fresh short positions. On the above chart displayed, we have considered the recent swing as a drop between 96.68 through the 95.25 levels, respectively. The perfect price to enter short position would be around the Fibonacci 0.618 resistance at the 96.10 levels with the risk above 96.68, respectively. Please note that the potential downside target remains close to 94.00 and lower, going forward.
Trading plan:
Aggressive traders might want to trade the counter trend rally with a stop below 95.00 and the target of 96.00
Conservative traders remain flat and look to sell rallies towards the 96.00/10 levels.
Good luck!
The material has been provided by InstaForex Company - www.instaforex.com