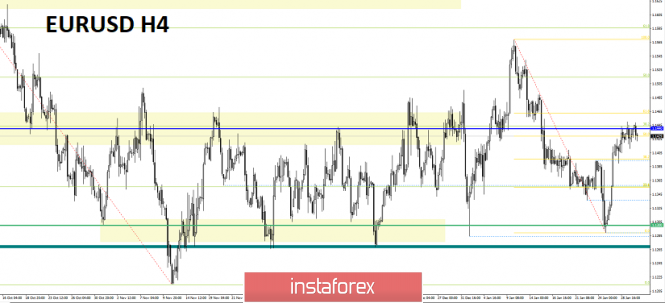
Over the past trading day, the Euro / Dollar currency pair showed a low volatility of 39 points, forming a cluster within the range level. From the point of view of technical analysis, we see stagnation within the range level of 1.1440 (1.1420 / 1.1460), where the quotation forms the amplitude of this type as early as the second day. Meanwhile, the news background had a vote in the British Parliament regarding a new plan for the country's withdrawal from the European Union. Naturally, Theresa May's plan "B" was not approved by the deputies, but edits were made in the form of a vote against postponing the UK's exit date from the EU, and also that the exit of a country from the EU is not possible without an agreement. The euro, in turn, did not react to everything that happens, and this is understandable, let us recall the statement of the European Commission that the current agreement, from their point of view.

Today, the focus of the Fed meeting and the subsequent press conference, where they are waiting for specifics about raising interest rates. From the news background there is data on unfinished real estate sales, as well as data on GDP (4Q), where it is expected to decline.
United States 16:30 Moscow time GDP (sq / sq) (Q4): Prev. 3.4% ---> Forecast 2.6%
United States 18:00 MSK Index of pending sales in the real estate market (m / m) (December)
22:00 MSK FOMC Statement
22:30 MSK FOMC Press Conference
Further development
Analyzing the current trading chart, we see how the quote has formed a cluster of 1.1420 / 1.1450, where the price is still developing. It is likely to assume that there is a process of accumulation and this is quite relevant on the eve of the Fed meeting. Traders, seeing this price development, are considering the possibility of stretching out pending orders on the subject of cluster breakdown and the appearance of volatility.

Based on the available data, it is possible to decompose a number of variations, let's consider them:
- We consider buying positions in case of price fixing higher than 1.1460.
- We consider selling positions in case of price fixing lower than 1.1410.
Indicator Analysis
Analyzing a different sector of timeframes (TF ), we see that in the short term there is a downward interest, but since we have a congestion, indicators of indicators may change. Intraday and medium term have an upward interest.
Weekly volatility / Measurement of volatility: Month; Quarter; Year
Measurement of volatility reflects the average daily fluctuation , with the calculation for the Month / Quarter / Year.
(January 30 was based on the time of publication of the article)
The current time volatility is 27 points. It is likely to assume that the only volatility generator of today is the Fed press conference, since if there was no information background, we would have remained within the framework of the low volatility cluster.
Key levels
Zones of resistance: 1.1440; 1.1550; 1.1650 *; 1.1720 **; 1.1850 **; 1.2100
Support areas: 1.1350 *; 1,1300 **; 1.1214 **; 1.1120; 1.1000
* Periodic level
** Range Level
The material has been provided by InstaForex Company - www.instaforex.com