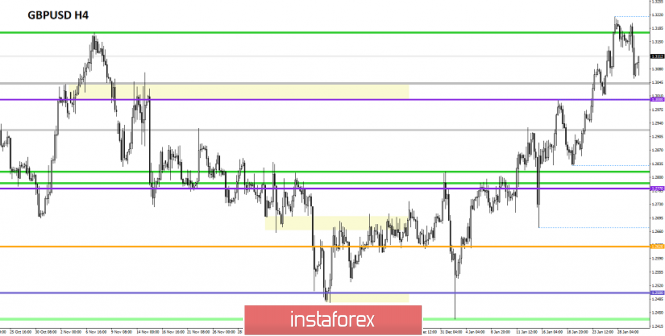
The currency pair Pound / Dollar for the last trading day showed a high volatility of 143 points,as a result forming a reverse movement. From the point of view of technical analysis, we have resistance in the face of the level of 1.3200, wherein after a two-day bumpiness, the quotation unfolded, forming impulse candles for more than 130 points.This movement was directly related to the information background in the form of a vote by the British Parliament regarding a new plan for the country's withdrawal from the European Union. What was accepted and not accepted? Naturally, Theresa May's "B" plan was not approved, but the deputies voted to amend the postponement dates of Britain's exit from the EU (voted against), and that the country's withdrawal from the EU is not possible without an agreement. On all this, the currency slipped, and we saw the same movement on the charts.

Today, the focus of the Fed meeting and the subsequent press conference, where they are waiting for specifics about raising interest rates. From the news background, there is data on unfinished real estate sales, as well as data on GDP (4Q), where it is expected to decline.
United States 16:30 Moscow time GDP (sq / sq) (Q4): Prev. 3.4% ---> Forecast 2.6%
United States 18:00 MSK Index of pending sales in the real estate market (m / m) (December)
22:00 MSK FOMC Statement
22:30 MSK FOMC Press Conference
Further development
Analyzing the current trading chart, we see that the quote has already reached the value of 1.3055, after which it went into a short-term pullback. It is likely to assume that the movement towards the psychological level of 1.3000 will continue, but then it's worth looking at the price fixing points.

Based on the available data, it is possible to cross out a number of variations, let's consider them:
- There are no buy positions. It is possible in theory to consider, in the case of a deceleration within the level of 1.3000.
- Positions for sale, as written in the previous review, speculators considered the point of 1.3110 for short positions. Perspective 1.3000. If we do not have positions, it is better to wait for the price to fix below 1.3000.
Indicator Analysis
Analyzing the different timeframe (TF) sector, we see that in the short and intraday perspective there is a downward interest against the background of the descent. The medium term perspective has changed to ascending.
Weekly volatility / Measurement of volatility: Month; Quarter; Year
Measurement of volatility reflects the average daily fluctuation, with the calculation for the Month / Quarter / Year.
(January 30 was based on the time of publication of the article)
The current time volatility is 53 points. It is likely to assume that at the time of the FOMC press conference, volatility could increase.
Key levels
Zones of resistance: 1.3200 * 1.3300; Zones of resistance: 1.3200 * 1.3300;1.3440 **; 1.3580 *; 1.3700
Support areas: 1.3000 ** (1.3000 / 1.3050); 1.2920 *; 1.2830 *; 1.2770 (1.2720 / 1.2770) **; 1.2620; 1.2500 *; 1.2350 **.
* Periodic level
** Range Level
The material has been provided by InstaForex Company - www.instaforex.com